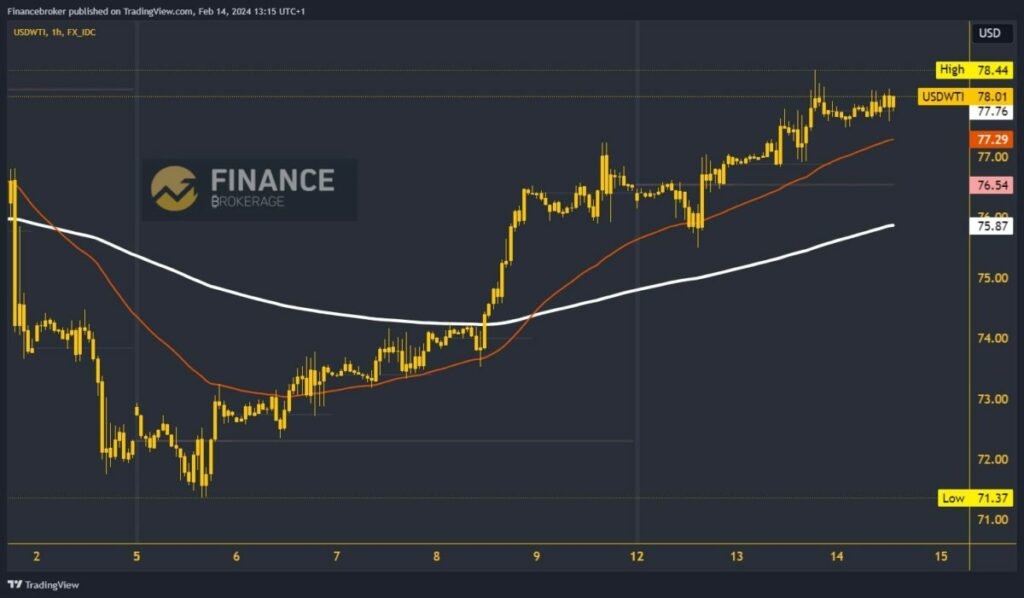
 Oil chart analysisThe oil price rose to $78.44 yesterday, forming a two-week high. After that, we are looking at consolidation in the $77.50-$78.00 range. It remained high and we expect to see continued growth to the bullish side.Potential higher targets are $78.50 and $79.00 levels. This afternoon, we will have news on The Energy Information Administration’s (EIA) Crude Oil Inventories, and depending on that report, there will be oil price movements.A drop in oil price to the $77.00 level would increase the bearish momentum. This would force the price to start a to a lower support level. Potential lower targets are $76.50 and $76.00 levels. EMA200 moving average is in the zone around $76.00 levels.
  Natural gas chart analysisThe price of natural gas fell yesterday to a new low of $1.72. Stopped exports by the US administration and good weather are holding the gas price to a new multi-year low. During the previous Asian session, the price managed to stay above that level and move up to $1.75. If we were to skip that level, we would have the opportunity to start a bullish consolidation in opposition.Potential higher targets are $1.80 and $1.85 levels. If the picture surrounding the natural gas export does not change, we will see a price retreat and the formation of a new low. Potential lower targets are $1.70 and $1.65 levels.
 More By This Author:
Oil Price Consolidation: $77.50-$78.00 Range Today

