Several risk on indicators surged higher into year-end, such as small-cap stocks and junk bonds.And as we typically see, this coincided with a big year-end stock market rally.Today, we take a look at the Junk Bonds ETF () to see if this is sustainable into Q1 of 2024.Above is a weekly chart of the JNK. As you can see, the Junk Bonds ETF has tested the Q1 2023 highs (resistance) for the past three weeks at (1). $JNK is also testing this important price level while its RSI is the highest in a few years at (2).To sum it up, junk bonds are overbought and testing price resistance… and starting to slip a bit. Stock market bulls hope JNK doesn’t continue lower. (Click on image to enlarge)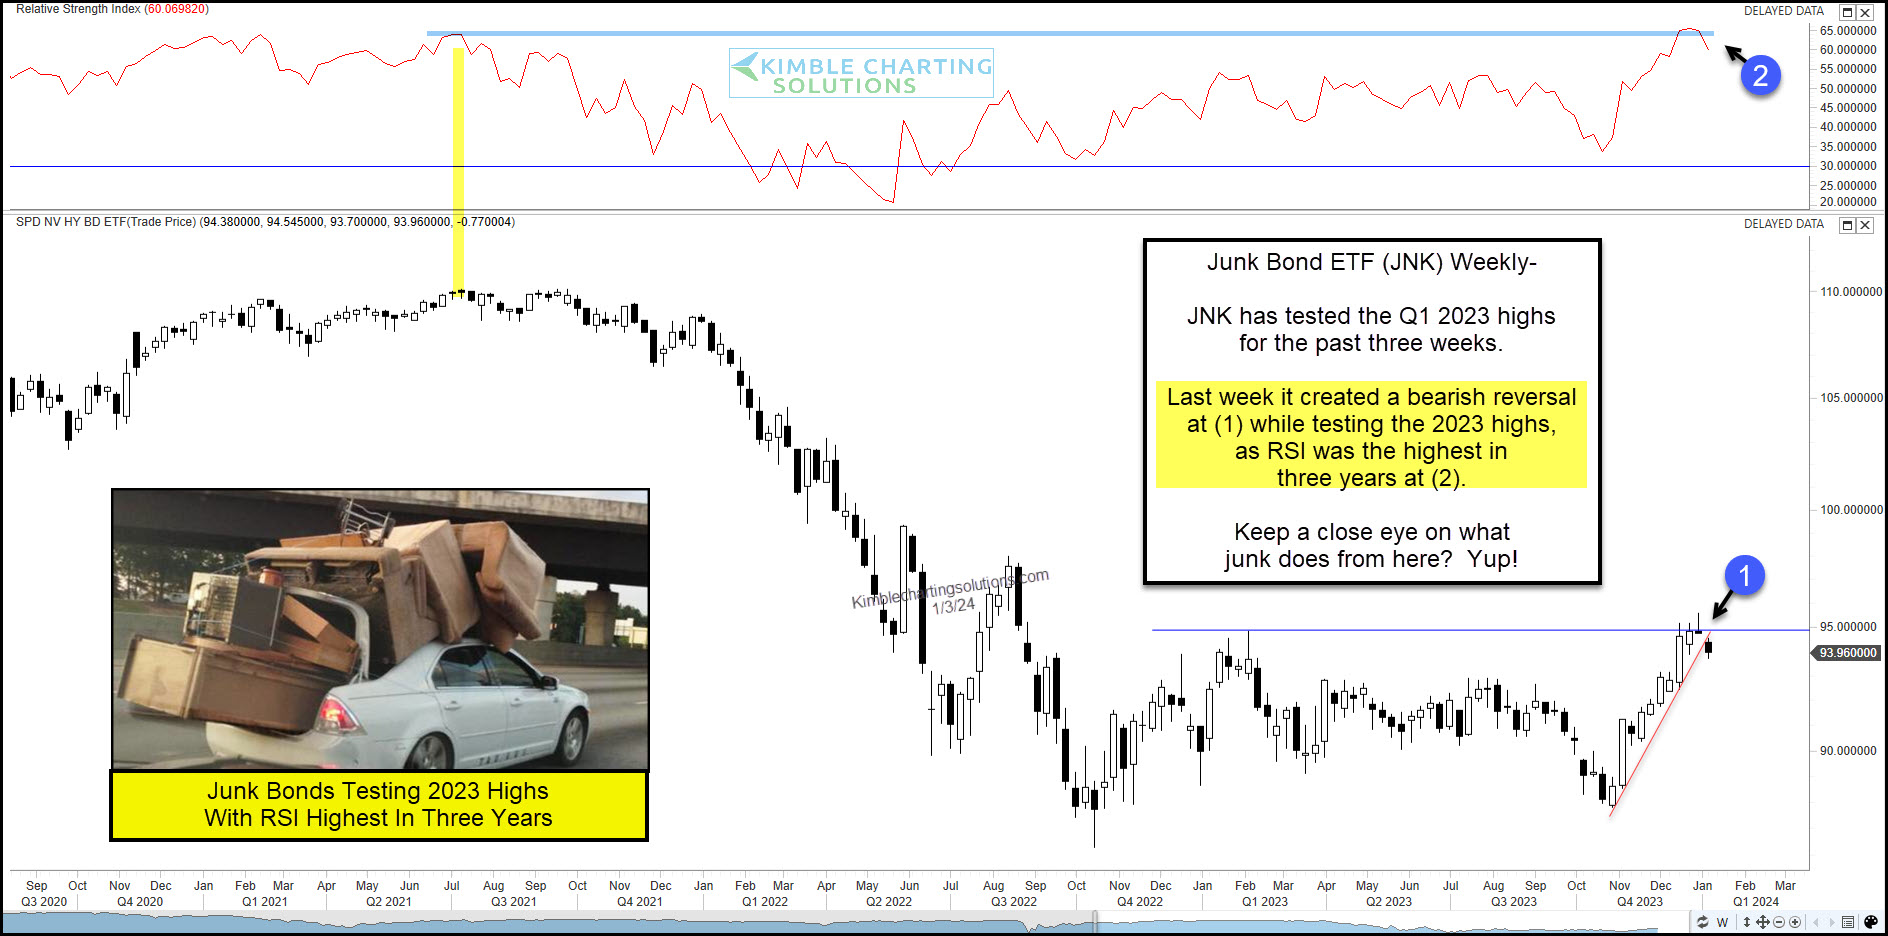 More By This Author:Are Small Cap Investors Getting Greedy At Important Resistance? Gold Indicator Testing Important Bullish Breakout Level Are Bond Yields Facing Historic Overbought Correction?
Are Junk Bonds Starting To Weaken? Stock Bulls Hope Not

