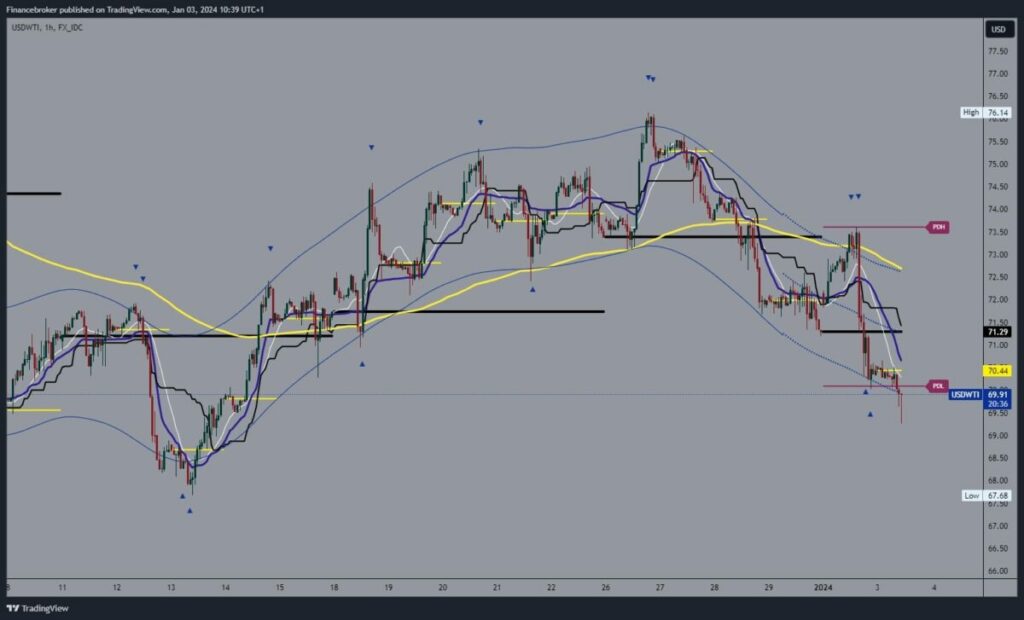
Oil chart analysisOn the first trading day of this year, the oil price started successfully but was limited only to the $73.50 level. Additional flow in that zone creates the EMA50 moving average, and the price breaks below and falls to a new low for the year. During the Asian session, the price stayed around $70.00, so we would see a breakout below and the continuation of the bearish option later in the EU session. The price formed a new low at $69.25, remaining under pressure to go further down.Potential lower targets are $69.00 and $68.50 levels. For a , we need a positive consolidation and to stabilize above the $70.00 level. If we succeed, the oil price will be in a good position to start a further recovery and move into a safe zone. Potential higher targets are $71.00 and $72.00 levels.(Click on image to enlarge) Natural gas chart analysisAt the beginning of the market opening this year, the price of natural gas jumped to the $2.64 level, forming a new one-month high. We stop there, and the price moves to the $2.50 level with bearish consolidation. We get new support there and recover to the $2.56 level. During the Asian session, the price hovered around $2.50 and managed to hold above it. In the previous hour we see a bullish impulse and an attempt to start with a further recovery to the bullish side.Potential higher targets are $2.58 and $2.60 levels. We need a negative consolidation and a price drop below the $2.50 level for a bearish option. In the zone around $2.46, we come across the EMA50 moving average. A break below would further increase the pressure on the price to go into a bearish continuation. Potential lower targets are $2.44 and $2.42 levels.(Click on image to enlarge)
  More By This Author:Forex Markets 2024: A New Era Of Global Trade DynamicsThe Year Of Forex Opportunities 2024: What To WatchThe Dollar Index Is Falling Below The 101.00 Level This Week
Oil And Natural Gas: Oil Is Retreating Below $70.00

