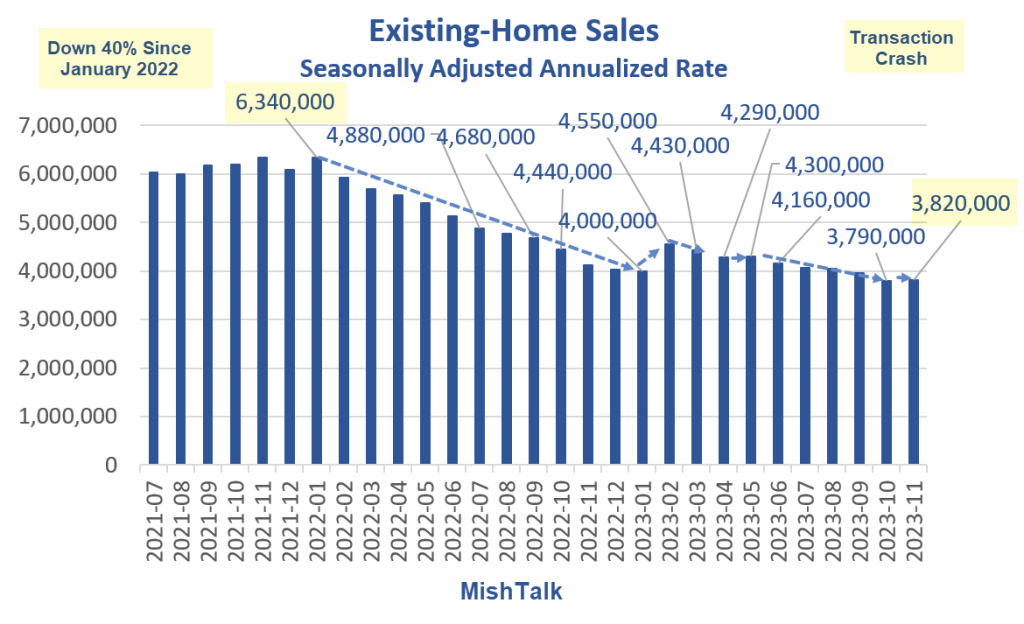
(Click on image to enlarge) Existing-home sales courtesy of the National Association of Realtors via the St. Louis FedThe National Association of Realtors® NAR® reports .
Existing-Home Sales Percent Change From Last Month(Click on image to enlarge)
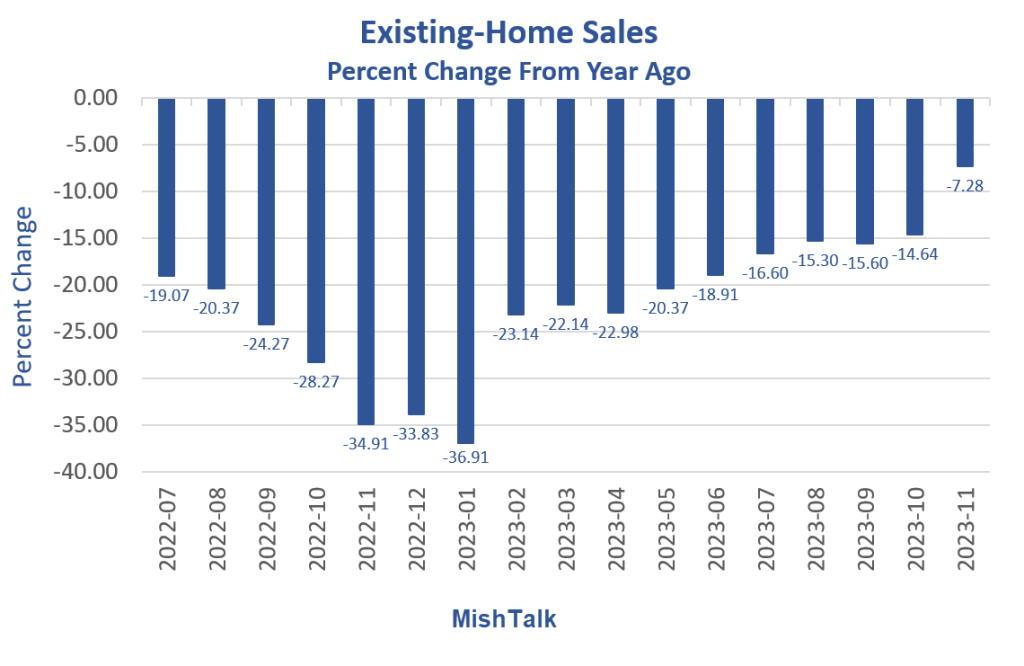
Existing-Home Sales Percent Year Ago(Click on image to enlarge) The dramatic improvement is due to a slight rise coupled with very easy year-over-year numbers to beat from November of 2022.Transactions are down over 40 percent from January of 2022, the same as last month.
Existing-Home Sales Supply(Click on image to enlarge)
For all the moaning about supply, it is nearly double what it was ten months ago. Of course, transactions have plunged, boosting supply.Yun Expects Marked TurnNAR cheerleader Laurence Yun expects a “marked turn” as mortgage rates drop.Mortgage rates are down from a peak of 7.9 percent to 6.65 percent. This may entice some buyers, but for how long?Home prices are still going up. Yun says ““Only a dramatic rise in supply will dampen price appreciation.”Housing Starts Jump 14.8 Percent but Permits Sink 2.5 PercentHousing starts jumped 14.8 percent in November led by single family construction, up 18 percent. Revisions were negative.(Click on image to enlarge) Housing data from Commerce Department, chart by MishYesterday, I noted
Via incentives, mortgage write downs, and limited availability of existing homes to buy, the builders are holding up much better than real estate agents.
Major Boom-Bust Swings(Click on image to enlarge)
The major boom-bust cycles are largely a result of Fed policy. The results you see from 2020-present are almost entirely due to Fed QE then QT policy.How the Fed Destroyed the Housing Market and Created Inflation in PicturesFor discussion of the Fed’s role in this mess, please see Housing starts are a bit less than they were in 1959.Seldom a Worse Time to Buy(Click on image to enlarge) National and 10-city prices from Case-Shiller, BLS for other data, chart by MishExisting home prices hit a new record high in September. Even with the decline in mortgage rates, there has seldom been a worse time to buy.Case-Shiller is a far better measure of home prices than median or average prices which do not factor in the number of rooms, location, lot size, or amenities. However, the data lags by 4 months or so.For discussion, please see More By This Author:

