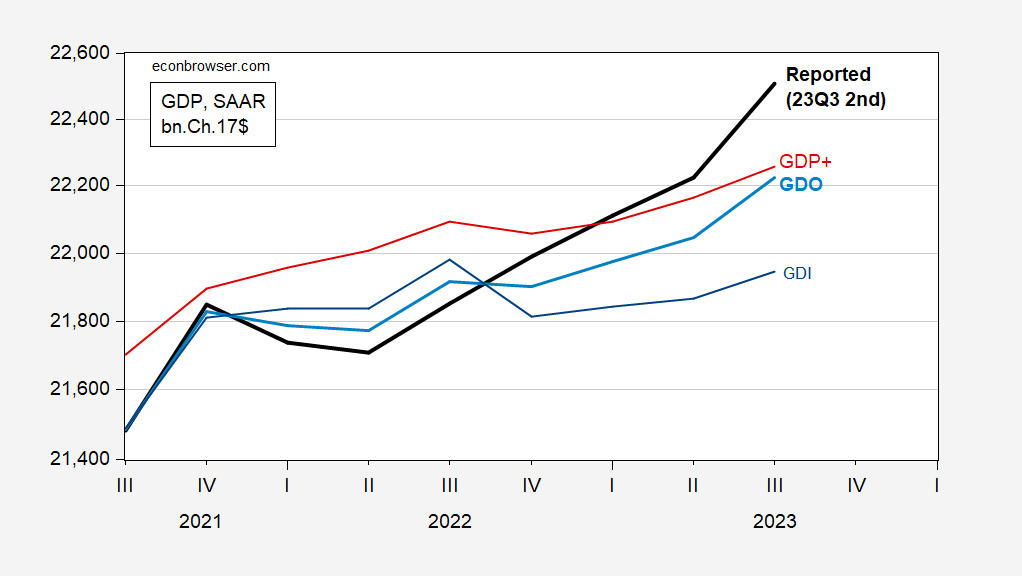
Lavorgna (SMBC Nikko) and Millar (Barclays) say look to GDI for a better estimate of economic activity. Both argue that GDI might better signal an incipient recession (): Figure 1: GDP (bold black), GDO (bold light blue), GDP+ (red), GDI (blue), all in bn.Ch.2017$ SAAR. GDP+ level uses GDP+ growth rates iterated on 2019Q4 GDP. Source: BEA 2023Q3 2nd release, , and author’s calculations.
GDI is indeed far below GDP ( asserts that GDP will be revised down toward GDI). It’s true that GDI has shrunk by 0.2% y/y; on the other hand, q/q annualized growth was +1.5%. In any case, My reading of the and , is that GDO — the arithmetic average of GDP and GDI — is a more accurate measure of final GDP, with GDP reverting more to GDO than otherwise. GDO growth is indeed more modest than GDP growth (3.3% vs. 5.2%, q/q SAAR).GDP+, published by the Philadelphia Fed, incorporates information regarding the revisions to obtain a more precise estimate of final GDP. One problem with comparing this series is that only growth rates are provided. I iterate the GDP+ growth rates on the 2019Q4 level of GDP (when GDP and GDO matched). The implied level of GDP+ is close to the same level as GDO in 2023Q3, but with yet again more modest growth.As point out (see), the statistical approach used in GDP+ makes the latent factor estimate of GDP less volatile than the observed. GDP++ does not incorporate this requirement. In the 2021Q3-22Q2 period, GDP++ growth matches GDO.From my standpoint, I’d put more weight on GDO than on strictly GDI (or GDP, for that matter). That would imply economic activity is 1.25% lower than indicated by the expenditure side measure (GDP).More By This Author:Business Cycle Indicators Including Monthly GDPThe Foreign Born Labor ForceA Decomposition Of Per Unit Price Inflation In Nonfinancial Corporate Sector, Through 2023Q3
Is Economic Activity Really A Lot Lower Than It Seems?

