 Image Source:
Gold prices are continuing to drift into the upside, holding on the high side of $2,040 on Wednesday. Gold hit its highest bids in six months.The XAU/USD briefly ticked over $2,050 in the early Wednesday session before slipping back into $2,035, and Spot Gold is now testing back towards $2,050 heading into the back segment of the day’s trading session. The day’s bullish target will be setting fresh daily highs above $2,052.An upside beat for US Gross Domestic Product (GDP) growth figures is mixing with surprisingly hawkish Fedspeak from Federal Reserve (Fed) Bank of Richmond President Tom Barkin, who noted that rate hikes might not be entirely off the table if inflation resumes climbing.
US Real GDP grows, Fedspeak sends mixed messages
growth clocked in at 5.2% for the third quarter, beating the market forecast of 5.0% and climbing over the previous quarter’s 4.9% showing.Next up on the economic calendar will be Thursday’s US Personal Consumption Expenditure (PCE) Price Index for the month of October. Wall Street is expecting PCE inflation, the Fed’s favored method of measuring price growth, to print a slight downtick with investors hoping that inflation continues to cool at a steady pace in the US.MoM PCE inflation is expected to come in at 0.2% vs 0.3%, while the annualized period into October is expected to print at 3.56% versus September’s 3.7%.stated on Wednesday that he is unwilling to take further rate hikes off the table once and for all, noting that he believes inflation will remain stubborn for longer than markets are currently pricing in.Richmond Fed President Barkin remains skeptical that US inflation will be returning to 2% anytime soon without active involvement from the Fed.
XAU/USD Technical Outlook
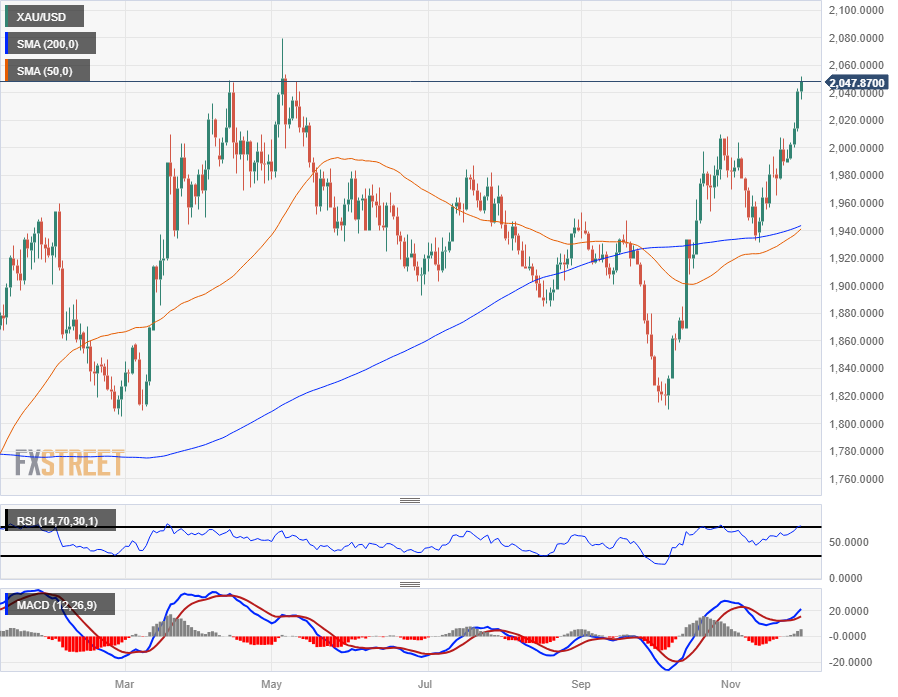
Spot Gold continues to bid into the high end, staring straight down the mouth of 2023’s highs around $2,080, and the pair is drifting higher as markets continue to push up the XAU/USD after decisively reclaiming the $2,000 handle on Monday.Gold continues to rally after catching a rebound from the 200-day Simple Moving Average (SMA) near $1,940, and upside price action is seeing a squeeze in the moving averages, with the 50-day SMA set for a bullish crossover of the 200-day SMA as long as topside momentum holds.
XAU/USD Daily Chart
(Click on image to enlarge)
XAU/USD Technical Levels
More By This Author:

