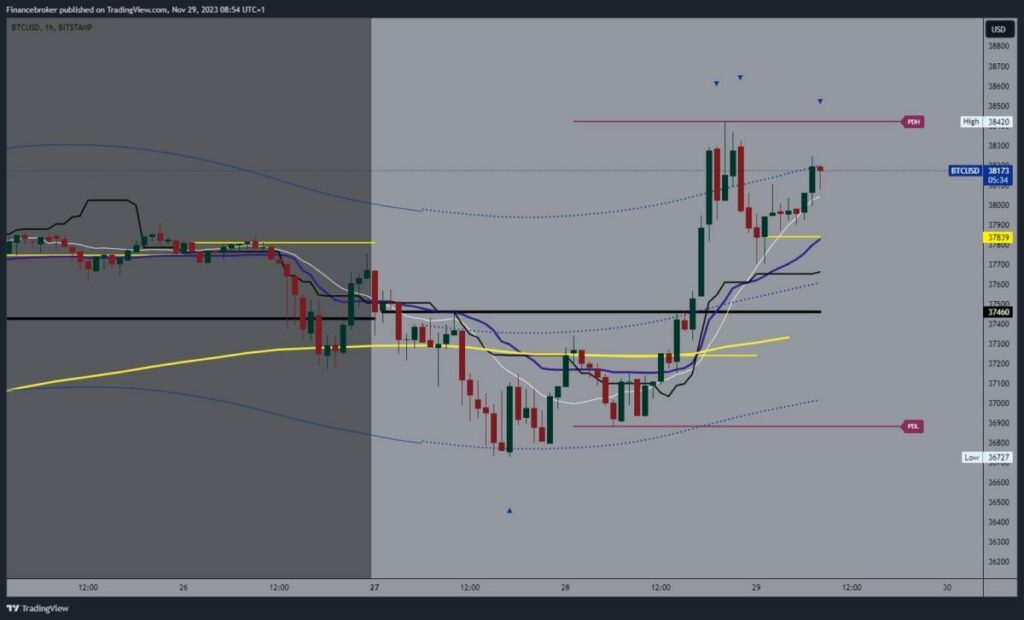
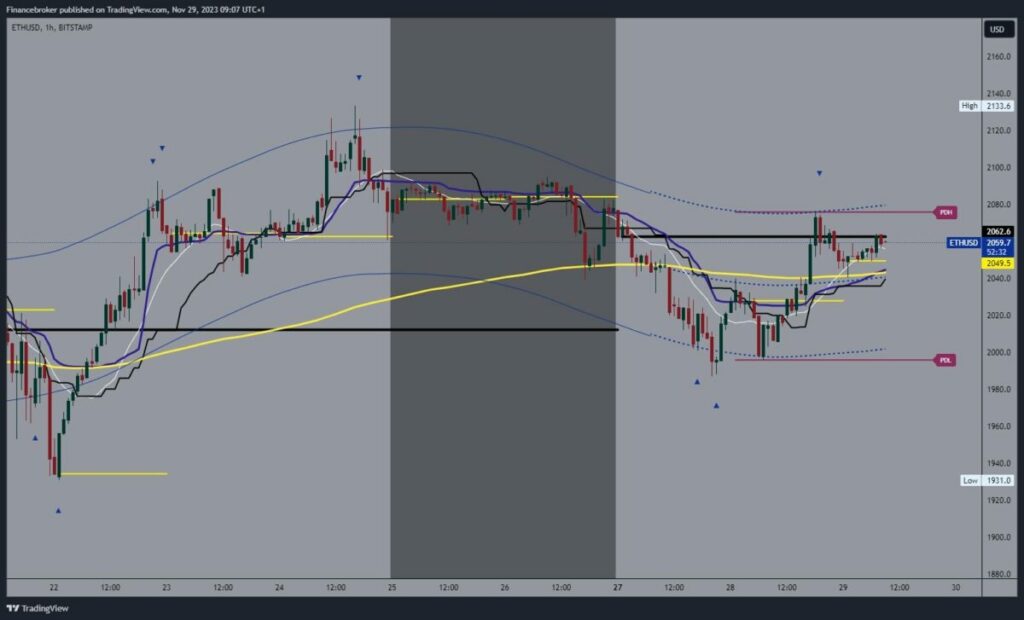
Bitcoin chart analysisYesterday’s Bitcoin price support at $37,000 initiated a bullish consolidation to the $38,420 level. We managed to form this week’s high for now. This was followed by a pullback to the $37800 level, where we got support and started a new bullish consolidation. Bitcoin is climbing above the $38,000 level again, currently consolidating around the $38,200 level. Potential higher targets are $38400 and $38600 levels.For a bearish option, we need a negative consolidation and a new price to support at the $37800 level. A longer stay in that zone could influence us to see a breakout below and the formation of a new low. Potential lower targets are $37600 and $37400 levels. Additional support for the price in the zone around $37,400 was provided by the EMA50 moving average.(Click on image to enlarge) Ethereum chart analysisYesterday’s bullish consolidation of the price of Ethereum was stopped last night at the $2080 level. After that, we see a pullback to support at the $2040 level. In that zone, we get additional support in the EMA50 moving average and start with a new positive consolidation up to the $2060 level. Now, we expect to see a continuation to the bullish side and a break above the $2080 level.Potential higher targets are $2090 and $2100 levels. We need a price drop below the $2040 level and the EMA50 moving average for a bearish option. In this way, there will be increased pressure on the price to see a further pullback to the next support level. Potential lower targets are $2020 and $2000 levels.(Click on image to enlarge)
  More By This Author:
Bitcoin Is Back Above $3800 And Ethereum Is Just Up To $2080

