The other catalyst for Bitcoin is in the futures market. Bearish view
Bullish view
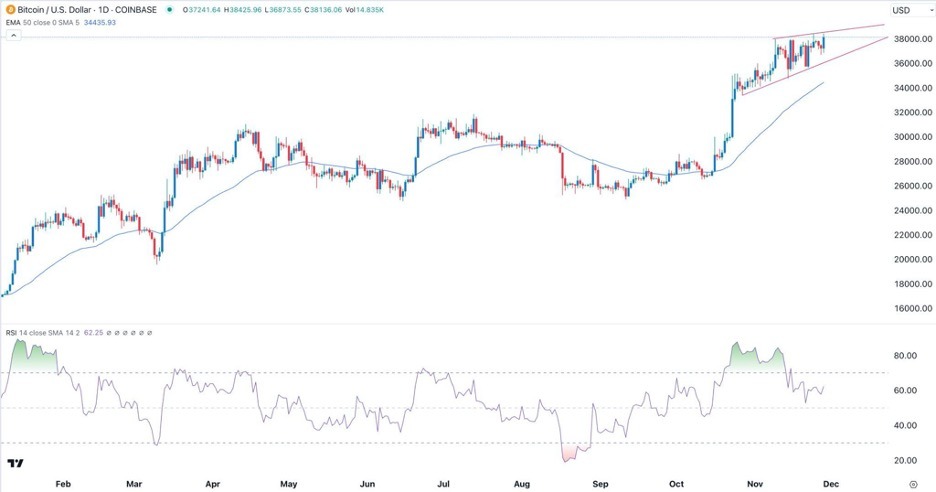
Bitcoin price continued its bullish trend as it reached its highest point since May 2022, helped by the dovish statement by Christopher Waller. The BTC/USD pair has risen in the past seven straight weeks, outperforming key assets like stocks and commodities. It was trading at 38,400, much higher than the year-to-date low of 15,296. Christopher Waller dovish statementThe main catalyst for the BTC/USD pair was a statement by Christopher Waller, one of the most hawkish Fed officials. In his statement, he sounded optimistic that the bank was successful in engineering a soft landing.As a result, he expects that the Fed will likely start cutting interest rates in 2024. Most analysts believe that he will cut rates by 0.25% by June. If this happens, it will be a major reversal now that the bank has hiked rates from zero to about 5.50%.The view of rate cuts in 2024 has been supported by the recent trends in inflation. Economic data by the Bureau of Labor Statistics (BLS) shows that the headline Consumer Price Index (CPI) to 3.2% in October.Core inflation also fell to 4.0% during the month. There are signs that inflation has continued falling, helped by lower crude oil prices. Brent has fallen to $80.60 while West Texas Intermediate (WTI) moved to $76.50. The average gasoline price has moved to $3.20.All this explains why American bond yields have retreated this month. The 10-year bond yield dropped to 4.33% while the 30-year has moved to 4.55%. The two yields rose above 5% a few weeks ago.The other catalyst for Bitcoin is in . A closer look shoes that the next-month contract was trading at a notable premium to the front month contract. This situation happened last in 2018. BTC/USD technical analysisThe BTC/USD pair has been in an uptrend in the past few days. On the daily chart, the pair has remained much higher than the 50-day moving average. At the same time, Bitcoin has formed a rising wedge pattern, which is a bearish sign. The Relative Strength Index (RSI) has formed a bearish divergence pattern.Therefore, the short-tem outlook for the pair is neutral for now. It will likely retest the lower side of the wedge pattern at around 37,000. A move above the upper side of the wedge pattern will open the possibility of it moving to 40,000.(Click on image to enlarge) More By This Author:GBP/USD Analysis: Caution Against Profit-Taking SalesEUR/USD Analysis: The Bulls’ Dominance ContinuesBTC/USD Forex Signal: Bullish Consolidation Continues Near High

