Talk of a tame CPI report this month is entirely an energy mirage and easy year-over-year comparisons. Food is a particular case in point. CPI data from the BLS, chart by MishCPI Food Facts
Year-Over-Year Statistical Mirage Food at home is only up 2.1 percent vs a year ago. That is due to to easy year-over-year comparisons.CPI Six Food Categories Year-Over-Year
 CPI data from the BLS, chart by Mish If all you eat is dairy, you are in luck. The price vs a year ago has gone down.CPI Food Index Levels Since 1970
 CPI data from the BLS, chart by Mish Rather than media-reported headline numbers, that chart better depicts how it feels to the grocery shopper. Let’s hone in on that.CPI Food Index Levels Since 2020
 CPI data from the BLS, chart by Mish Price Change vs Two Years Ago
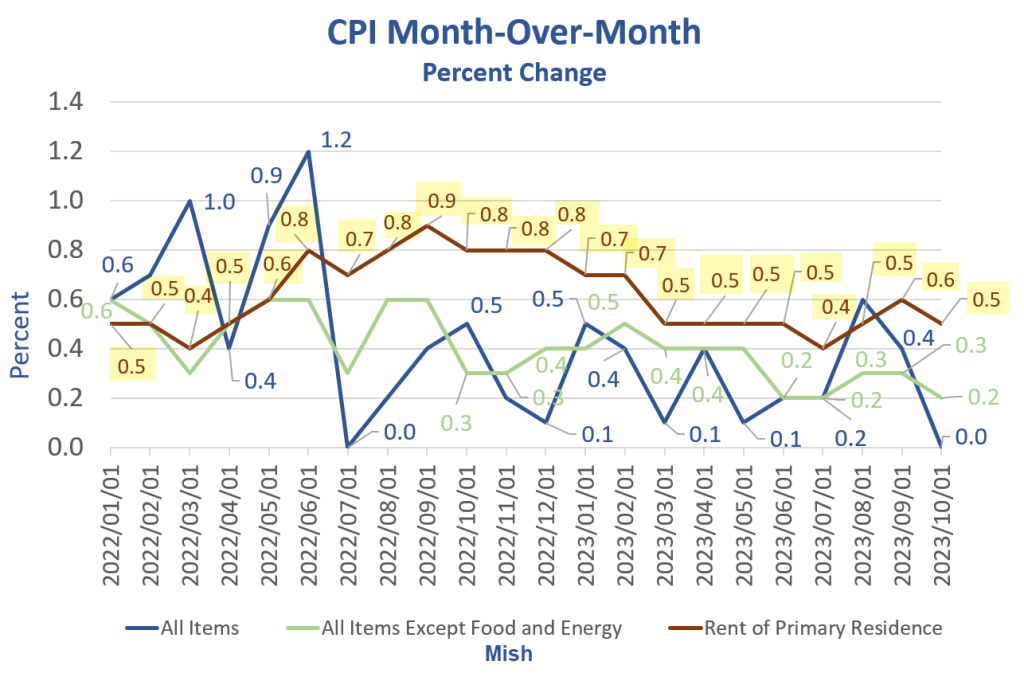
I am sure glad the price of dairy is falling and the price of food at home is only up 2.1 percent.What About Rent? CPI month-over-month data from the BLS, chart by Mish A 2.5 percent decline in energy smoothed the CPI in October. But for the 27th straight month, the cost of rent rose at least 0.4 percent.For discussion and details, please see Don’t worry about food and rent because the Fed’s “Super-Core Indexes” exclude food, energy, and rent. So does Paul Krugman. Krugman’s “super-super core” also excludes used cars.Last month I reported Phew, everything is OK. But this leads to the dilemma of the day:Why Are Americans in Such a Rotten Mood?For discussion, please see I’m pleased to report that mood has nothing to do with food or rent. It’s all the Media’s fault. Please click on the above link if you haven’t already for a real hoot on why this is the media’s fault.More By This Author:CPI Unchanged Thanks To Decline In Energy, But Rent Jumps 0.5 Percent Interesting Tweet Reading to Start the Week: Tesla, Inflation, Delinquent CRE, MoreThe Inevitable Money Laundering Attack On Crypto Picks Up Steam

