The British pound somehow managed to climb higher against the US dollar, but it looks like struggling against the Australian dollar. However, we cannot say that the GBPAUD pair will move lower or reverse as there are several support levels on the way down for the pair. Later during the London session, the UK manufacturing PMI and mortgage approval data will be released. There can be some moves in the British pound. So, let us analyse the GBPAUD pair and gets a view where it might head in the coming session. Traders trading other pound pairs can also get an idea how it might trade in the near term.

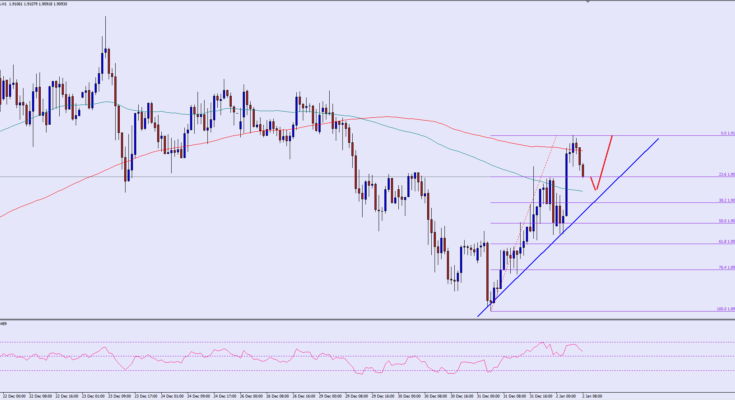
There is a bullish trend line formed on the hourly chart of the GBPAUD pair, which is likely to act as a barrier for sellers. The pair recently traded towards the 1.9140 level where it found resistance in the form of the 200 hour moving average. Currently, the pair is correcting lower towards the highlighted trend line. The most important point is that the 100 hour MA is also sitting around the same trend line. Moreover, the 38.2% fib retracement level of the last leg from the 1.8949 low to 1.9139 high is around the same area. So, there is a major support around the 1.9065-60 area and the pair might struggle to break the same in the short term.
On the upside, the last high of 0.9137 might act as a barrier for buyers. However, if the economic releases in the UK come on the positive side, then the GBPAUD pair might climb higher.
Overall, one might consider buying dips as long as the pair is above the highlighted trend line.
————————————-
Posted By Simon Ji of IKOFX


