- GBP/USD has been hovering close to 1.40 as the dollar is off its highs.
- Optimism about US stimulus, the UK reopening and data may push cable over the line.
- A fresh increase in US yields could ruin the party.
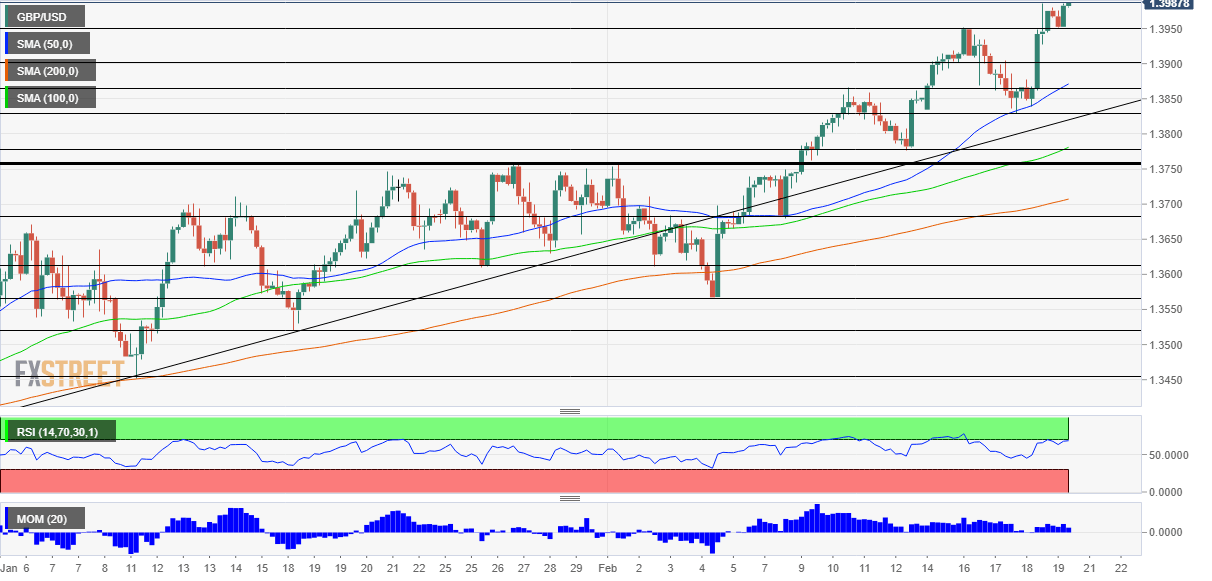
- Friday’s four-hour chart is showing bulls are in control.
Who can stop cable’s bull run? A quick look at the chart is showing that every dip is followed by a surge higher – fresh 34-month highs almost on a daily basis. And now, the big prize is 1.40.
How fast will Britain return to normal? While some in continental Europe are hesitant about AstraZeneca’s COVID-19 vaccines, they are deployed at full speed in the UK. A combination of immunizations and the lockdown has brought Britain’s infections and hospitalizations sharply lower.
All eyes are now on Prime Minister Boris Johnson and his highly-anticipated reopening speech on Monday. Leaks from Downing Street may come on Friday. IF the plan is ambitious, it could give sterling the boost to bring it over the line.
Will weak UK data hold the pound back? Not so fast. Retail sales plunged by a whopping 8.2% in January, far worse than expected and a worrying sign for the economy moving forward. Nevertheless, GBP/USD continues its upward march. That can only lead to one conclusion – cable is showing its resilience and has more room to rise in response to even marginally better data. Markit’s preliminary Purchasing Managers’ Indexes for February are next.
In the US, President Joe Biden continues pressing Congress to advance his proposed $1.9 trillion covid relief package, or at least most of it. Moreover, the Washington Post reported that Democrats are considering a second bill – this time a classic stimulus one that would focus on infrastructure. The sum thrown in the air is no less than $3 trillion.
While more money from Uncle Sam is positive for the global economy, it could push US ten-year yields to new highs. The global benchmark is already at around 1.30% and a move toward 1.50% would make the dollar more attractive and boost the greenback. More government spending means both stronger growth and also more debt issuance – causing returns to rise.
On both sides of the pond, prospects are improving and that is positive for the “risky” pound in comparison to the “safe” dollar.
GBP/USD Technical Analysis

Pound/dollar is trading close to 1.40, and hitting that level may trigger choppy price action – many orders are likely placed around the round number. The Relative Strength Index on the four-hour chart is nearly 70 – on the verge of overbought conditions and indicating that a breakout could be followed by a pullback. The currency pair is trading above the 50, 100 and 200 Simple Moving Averages, a bullish sign.
All in all, there is room for more gains, yet it may hit short-term roadblocks.
Above 1.40, the next lines to watch date to 2018 and these include 1.4110, 1.42 and 1.4240.
Support awaits at 1.3950, the previous 2021 peak, followed by 1.39, then by 1.3880, and finally 1.3830.
Where next for stocks, gold and Bitcoin in a world where bad news becomes good news


