Here is a brief review of period-over-period change in short interest in the August 16-31 period in nine S&P 500 sectors.
XLBÂ (SPDR materials ETF)
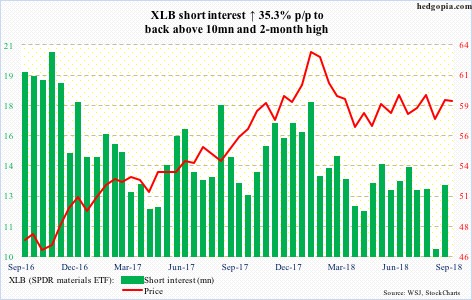
XLB (59.20) continues to go back and forth around its 50- and 200-day moving averages (currently in between). Late August, it rallied to 60.29, but only to get rejected at a falling trend line from late January. The ETF is in the midst of a giant descending triangle, with support at 57, which has been defended several times since February.
XLEÂ (SPDR energy ETF)
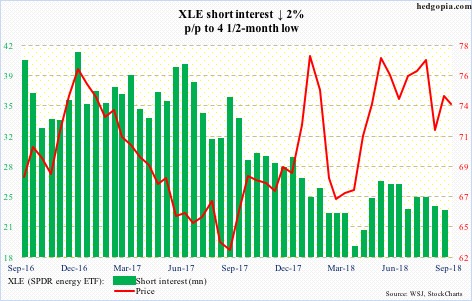
After a mid-August test, the 200-day (72.85) was tested again last week. XLE (73.84) in the meantime is held down by a falling trend line from May 22 when it peaked at 79.42. That resistance gets tested around 75, which is where the 50-day lies. Potential fuel for short squeeze is much less compared to a year ago.
XLFÂ (SPDR financial ETF)
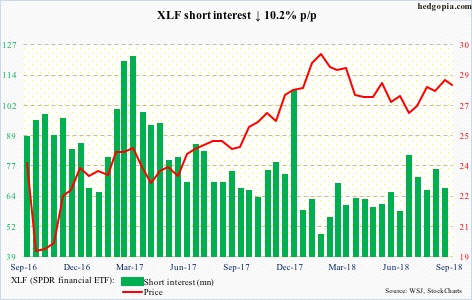
XLF (28.07) broke out of a falling trend line from late January mid-July, but building on it has proven tough. Sellers continue to show up at 28.50. Short interest has slightly built up over the past seven months. Wednesday, the ETF closed right on the 200-day. Bulls will start sweating once they lose 26.70.
XLIÂ (SPDR industrial ETF)
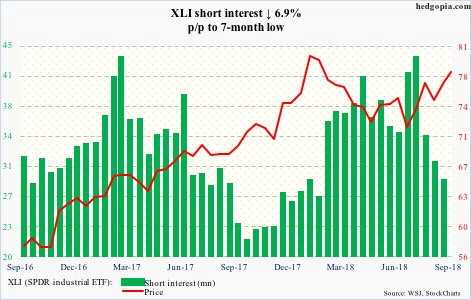
Since peaking mid-July, XLI (78.21) short interest is down 33.6 percent. The ETF rallied strongly during that period. Wednesday, it rose to a six-month high. Conditions are overbought, but momentum is yet to break. There is decent support at 77.
XLKÂ (SPDR technology ETF)
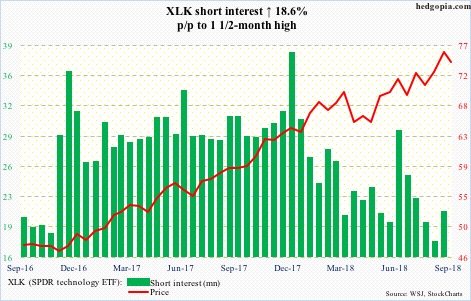
On August 30, XLK (74.13) rose to a new all-time high of 76.03 in a long-legged doji session. Having gotten aggressive post-presidential election (November 2016), shorts lent a helping hand. By the August 1-15 period, all that buildup was gone. In the latest period, shorts added a bit. Since that high, the ETF has come under pressure, but nothing major. Bulls thus far have defended a rising trend line from April, with sideways action the past five sessions right above the 50-day. Medium term, breach risks are rising.

