It isn’t hard to appreciate the market’s negative reaction to the Wells Fargo (WFC) and Citigroup (C) reports, but the lukewarm reaction to the JPMorgan (JPM) report is likely reflective of continued weak sentiment for the group.
The fact is that JPMorgan’s report represented all around strength and offers useful read-throughs for what to expect from pure-play investment banks, trust banks and regional operators in the coming days. We have a busy reporting docket this week, with more than 170 companies coming out with quarterly results, including 60 S&P 500 members. Â
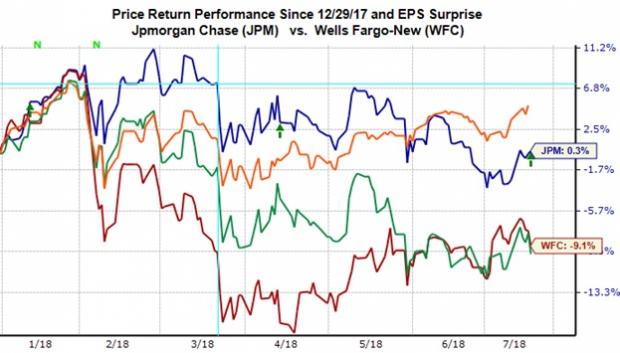
As you can see in the year-to-date performance comparison of Citi, JPMorgan, and Wells Fargo shares relative to the S&P 500 index (orange line), the banks have lagged the broader market, with Citi and Wells doing badly.

As discussed in this space last week, a big contributor to the group’s recent underperformance is the flattening yield curve. Lately, yield spreads have compressed significantly as the shorter end of the curve has gained ground in response to the market’s Fed expectations while long-term yields have been held down by lack of inflation expectations and safe-haven flows around the trade uncertainty. Â
Â
With respect to the actual results, there is plenty to like in the JPMorgan report while Citi’s results were modestly disappointing and Wells’ report was weak as well as ‘noisy’. JPMorgan’s loan portfolio increased a respectable +4% from the same period last year and +2% from the preceding period. Earnings at the bank’s investment banking unit increased +18% from the year-earlier period, with trading revenues increasing +13%. The one area of weakness was the mortgage unit, with mortgage volume down -10% and revenues down -6% from the year-earlier period.
Mortgages are a much bigger deal with Wells Fargo, with earnings in the bank’s mortgage unit down by almost a third from the same period last year and the overall loan portfolio down -1.4% from the earlier period. The bank had a number of ‘charges’ in its report as well, though we don’t exclude these charges from the bank’s ‘recurring’ earnings as these charges have effectively become a regular part of its results as it continues to put the September 2016 scandal behind it. The combination of increased outlays for regulatory and compliance strictures and weakness in the mortgage business resulted in -2.5% lower earnings on -2.8% reduction in revenues.
The Citi disappointment is centered primarily on weakness in trading and credit cards, with trading revenues down -1% from the year-earlier period even though management had guided towards a flat showing on this count. The bank’s loan portfolio was up +4% while expenses were flat from the year-earlier period. Thanks to lower taxes, Citi’s Q2 earnings were up +16.2% from the same period last year on +3.2% higher revenues.
Finance Sector Scorecard (as of Friday, July 13th)
We now have Q2 results from 4 of the 99 Finance sector companies in the S&P 500 index. Keep in mind however that these 4 companies account for 21.3% of the sector’s total market capitalization in the index.
Total earnings for these four Finance companies are up +11.4% from the same period last year on +3.6% higher revenue growth, with 75% beating EPS estimates and 100% beating revenue estimates. The comparison charts below put the results thus far in a historical context.

As you can see in the chart above, the sector’s growth picture is tracking above the 4- and 12-quarter averages, but below what we had seen from these stocks in the preceding quarter. These comparisons will likely change as Bank of America (BAC),Goldman Sachs (GS) and Morgan Stanley (MS) report quarterly results next week.
For the quarter as a whole, total Finance sector earnings are expected to be up +21% from the same period last year on +3.6% higher revenues. This would follow +25.1% earnings growth in 2018 Q1 on +4.8% higher revenues.
The table below shows the sector’s Q2 earnings expectations at the medium industry level. We show Q2 expectations in the context of what was actually reported in the preceding three quarters and what is expected in the following four periods at the medium-industry level.

The chart below shows the same data at the aggregate sector level. The strong earnings growth of the first half of 2018 is expected to continue in the back half as well.

Please note that the sector’s strong growth this year is for the most part to thanks to the tax legislation. You can see that in the above chart by focusing on the revenue growth pace (orange bars). Revenue growth for the group is positive, but nothing to get overly excited about.
Q2 Earnings Season Scorecard (as of July 13th, 2018)
We now have Q2 results from 27 S&P 500 members, with total earnings for these 27 companies up +19.1% from the same period last year on +9.7% higher revenues, with 88.9% of the companies beating EPS and revenue estimates.
We probably shouldn’t draw any firm conclusions from the results thus far, but this is nevertheless a good start to the Q2 reporting cycle, as the comparison charts below show.

The way to read these charts is that Q2 earnings and revenue growth (left-hand chart) for these 27 index members is above the 4- and 12-quarter averages, but the comparison to the preceding period (2018 Q1) is mixed, with earnings growth (+19.1%) tracking below and revenue growth (+9.7%) inline.
