In our last SPX update  we concluded that the 1 x 1 angles and the CIT Cloud will provide us with directional guidance for the rest of the week, and that the key levels to monitor are 2700 – 2740 and 2788 – 2800.
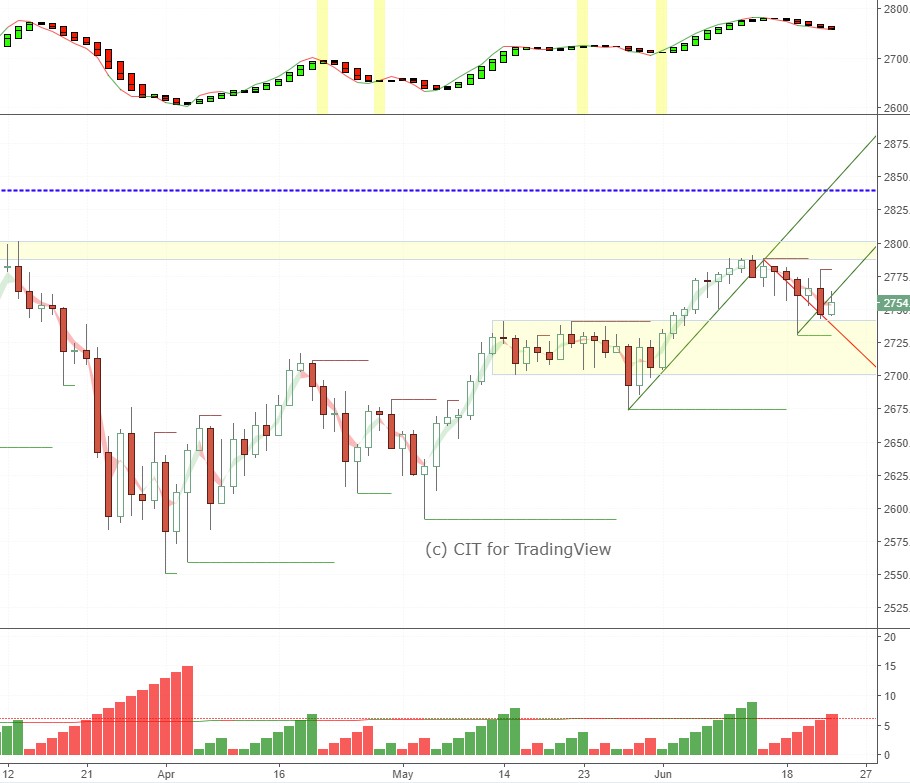
This proved to be the case as the SPX remained stuck between 2740 and 2778, and continued sliding along with the bearish angle and the CIT Cloud. On the positive side, 2740 was never broken on a closing basis, and the current down-swing has already exceeded the average swing time duration, signaling that the next up-swing could start at any time now.
The projected trading range for next week for the SPX is 2700 – 2800, and the focus remains on 2700 – 2740 and 2788 – 2800:

Weekly bullish sentiment took a hit but remains positive (above 50%):

You can keep track of our daily and intraday market updates here.
EURUSD made a double bottom at 1.15, which coincided with our lower target, and generated a buy signal in the process.
The projected trading range for next week for EURUSD is 1.15 – 1.175:

The Pound reached our down-side target as well and bounced off sharply, giving a swing buy signal.
The projected trading range for next week for GBPUSD is 1.305 – 1.34:

USDCHF came within a few pips of our upside target and reversed sharply.
The projected trading range for next week for USDCHF is 0.982 – 1.00:

USDJPY wasn’t able to gain much traction and remained stuck in a narrow trading range for the second week in a row. Strong support at the 109.8 level.
The projected trading range for next week for USDJPY is 109 – 111:

USDCAD broke briefly above our upside target but finished the week within the projected trading range.
Incidentally, the current up-swing count equals the previous bull run of 33 days.
The projected trading range for next week for USDCAD is 1.315 – 1.34:

AUDUSD was the mirror image of USDCAD. It traded below our low target for most of the week but staged a reversal on Friday and closed in the middle of next week’s projected trading range. The reversal level was picked up nicely by the 2 x 1 bearish angle from the June 6th high, and marked the exact point where price and time were in balance (which wasn’t the case on June 19th for example).
