Our weekly best and worst reports show you stocks with the best potential returns over the coming 6 to 12 months. Â The score is calculated by fusing together the key drivers of price movement including earnings beats, earnings growth, at-the-market insider buys, institutional activity, short ratio analysis, price to earnings analysis and calendar quarter seasonality.
We believe that those stocks appearing in our best list are buys while those appearing in our worst list are sells.
Since 11/6/12, the highest scoring names in large cap returned 31.26%, 531 bps more than the SPX with 0% turnover.  The top performers were ASML up 103%, MGA up 91% and PXD up 88%.
Currently:
The average large cap score is 72.61, slightly below the 4 week average score of 73.31. The average large cap is trading 6.52% above its 200 dma, has 4.29 days to cover short and is expected to see EPS growth of 13.21% next year.
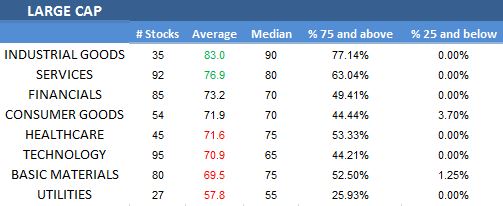
The best large cap sector is industrial goods. Services also score above average. Financials and consumer goods score in line. Healthcare, technology, basics and utilities score below average.
Â

Â
Â
