At the Consumer Metrics Institute we have a unique perspective on the economy. We measure consumer demand on a daily basis, providing nearly two orders of magnitude more resolution than the BEA’s GDP releases. This is like moving from naked eye observations to using a lab-grade microscope. As a result we can see timing relationships that simply can’t be seen in quarterly data.
Here is our latest report with charts updated as of Dec. 7, 2013.Â
[For background on the Consumer Metrics Institute’s methods for gaining unique insight into the economy, read a 2010Â interview with Rick and Ilene here.]
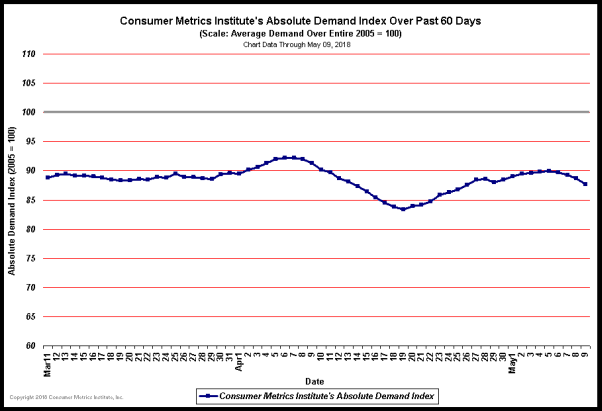
Daily Absolute Demand Index
Â

(Click here for best resolution)
Â
Notes:
Â
(1) A projection of our basic year-over-year data into an aggregate absolute demand, reflecting the compounding impact of extended expansions or contractions. The daily data is normalized such that the year-long average for 2005 would be at 100 in the chart.
Â
Monthly Absolute Demand Index(3)

(Click here for best resolution)
Â
Â
Notes:
(3) A projection of our basic year-over-year data into an aggregate absolute demand, reflecting the compounding impact of extended expansions or contractions. The data points represent month-long averages of the daily data, normalized so that the year-long average for 2005 would be at 100 in the chart. Â
Current Weighted Composite & Sector Index Values

(Click here for best resolution)
Â

Current Growth Index Values & Percentiles:

 (BEA’s GDP growth tables here.)
Commentary
December 5, 2013 – BEA Revises 3rd Quarter 2013 GDP Growth Sharply Upward to 3.60% Annual Rate:
In their second estimate of the US GDP for the third quarter of 2013, the Bureau of Economic Analysis (BEA) reported that the economy was growing at a 3.60% annualized rate, up a surprising 0.76% from the 2.84% growth rate previously reported for the quarter. The improvement in the headline growth number came principally from growing inventories (now contributing 1.68% to the headline, up 0.85% from the earlier report) and fixed investment (adding another 0.81% to the headline, an increase of 0.18% from the prior report). The contribution from consumers was reported to be weakening slightly, as were exports. Increasing imports also lowered the headline number somewhat (removing -0.43% from the headline, a change of -0.13 from last month’s estimate). And the BEA’s own “bottom line” growth rate for the economy (the “real final sales of domestic product”) weakened to a 1.92% annualized growth rate.
