
| Â | Daily Absolute Demand Index(1): | Â |
| Â |
 (Click here for best resolution) |
 |
| Â |
Notes: Â Â (3) A projection of our basic year-over-year data into an aggregate absolute demand, reflecting the compounding impact of extended expansions or contractions. The data points represent month-long averages of the daily data, normalized so that the year-long average for 2005 would be at 100 in the chart. Â |
 |
Â
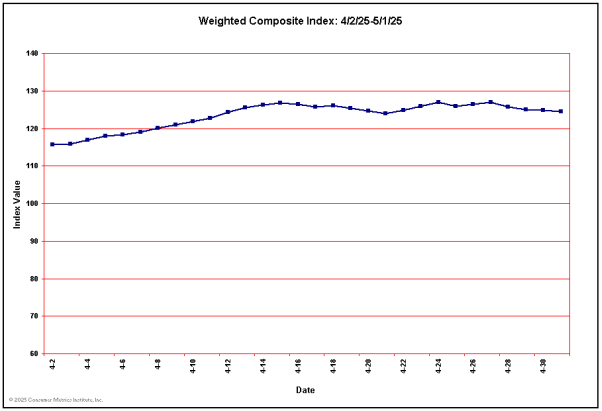
Current Weighted Composite & Sector Index Values
Â
(Click here for best resolution)
Last 10 Weighted Composite Index Values
| Date: | 12/23/2013 | 12/24/2013 | 12/25/2013 | 12/26/2013 | 12/27/2013 | 12/28/2013 | 12/29/2013 | 12/30/2013 | 12/31/2013 | 01/01/2014 |
| Value: | 97.05 | 97.34 | 98.27 | 98.40 | 98.34 | 97.27 | 97.21 | 96.86 | 96.51 | 95.78 |
Â
Current Values for Each of the Sector Indexes
| Sector: | Automotive | Entertainment | Financial | Health | Household | Housing | Recreation | Retail | Technology | Travel |
| Value(3): | 105.54 | 97.18 | 109.70 | 100.71 | 101.97 | 100.84 | 103.62 | 99.19 | 94.74 | 105.39 |
Â
| Â |
Notes:   (3) The 10 sectors contribute to our Weighted Composite Index according to weightings provided for their various sub-components by the United States Department of Commerce’s National Income and Product Accounts (‘NIPA’) Tables (see our FAQs page for further explanations). In general, components in our Housing Sector have the highest weightings for durable goods in the NIPA matrix, while components in our Retail Sector contribute dynamically to many different line items in the weighting matrix, depending on specific goods involved.  |
 |
