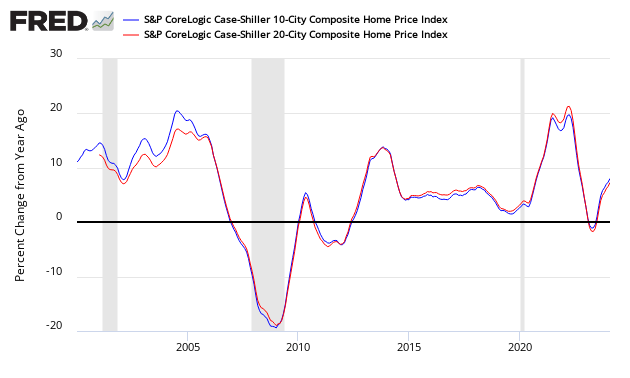
The non-seasonally adjusted Case-Shiller home price index (20 cities) for December 2013 (released today) declined slightly but showed the 19th consecutive monthly year-over-year gain in housing prices since the end of the housing stimulus in 2010.

Â
- Home price rate of growth decelerated 0.1% month-over-month.
- Home prices increased 13.4% year-over-year.
- The market had expected a year-over-year increase of 13.3% (versus the 13.4% reported).
- Case-Shiller continues to show the highest year-over-year home price gains of any home price index.
S&P/Case-Shiller Home Price Indices Year-over-Year Change

Comparing all the home price indices, it needs to be understood each of the indices uses a unique methodology in compiling their index – and no index is perfect. The National Association of Realtors normally shows exaggerated movements which likely is due to inclusion of more higher value homes.
Comparison of Home Price Indices – Case-Shiller 3 Month Average (blue line, left axis), CoreLogic (green line, left axis) and National Association of Realtors 3 Month Average (red line, right axis)

/images/z existing3.PNG
The way to understand the dynamics of home prices is to watch the direction of the rate of change. Here almost universally – home price growth is now decelerating.
Year-over-Year Price Change Home Price Indices – Case-Shiller 3 Month Average (blue bar), CoreLogic (yellow bar) and National Association of Realtors 3 Month Average (red bar)

/images/z existing5.PNG
There are some differences between the indices on the rate of “recovery†of home prices. However, the trend for over a year has been an improving home market.
A synopsis of Authors of the Leading Indices:
Case Shiller’s David M. Blitzer, Chairman of the Index Committee at S&P Indices, believes the strongest part of the home price recovery may be over.
The S&P/Case-Shiller Home Price Index ended its best year since 2005. However, gains are slowing from month-to-month and the strongest part of the recovery in home values may be over. Year-over-year values for the two monthly Composites weakened and the quarterly National Index barely improved. The seasonally adjusted data also exhibit some softness and loss of momentum.
After 26 months of consecutive gains, Phoenix posted -0.3% for the month of December, its largest decline since March 2011. Phoenix once led the recovery from the bottom in 2012, but Las Vegas, Los Angeles and San Francisco were the top three performing cities of 2013 with gains of over 20%. The Sun Belt, with the exception of Dallas, Miami and Tampa, saw lower annual rates in December when compared to their November numbers. The six cities with the highest year-over-year figures saw their rates decline (Las Vegas, San Francisco, Los Angeles, Atlanta, San Diego and Detroit) and most cities ranked at the bottom improved (Denver, Washington and New York) – Charlotte and Cleveland were the two exceptions.
Recent economic reports suggest a bleaker picture for housing. Existing home sales fell 5.1% in January from December to the slowest pace in over a year. Permits for new residential construction and housing starts were both down and below expectations. Some of the weakness reflects the cold weather in much of the country. However, higher home prices and mortgage rates are taking a toll on affordability. Mortgage default rates, as shown by the S&P/Experian Consumer Credit Default Index, are back to their pre-crisis levels but bank lending standards remain strict.

