US Monetary Backdrop
Last week we discussed the fact that China’s money supply growth has slowed precipitouslyand also looked briefly at somelong term euro area data. As we have mentioned on previous occasions, the annualized growth rate of US money TMS-2 has declined noticeably, but remains brisk in a longer term historical context. Between late 2008 and late 2012, the growth rate briefly dipped below 10% only once, as it was kept high not only via ‘QE1’ and ‘QE2’, but also the phenomenon of funds fleeing from euro-dollar markets into depository institutions in the US (in order to ensure financing of the dollar liabilities of European banks, these funds were partly replaced by the now permanent currency swap arrangements between central banks). The situation regarding euro-dollar deposits changed when the sovereign debt crisis abated; moreover, a blanket deposit guarantee for large scale deposits granted by the FDIC in the wake of the 2008 crisis expired, further reducing the advantage of holding such deposits in the US banking system.
Lastly, while ‘QE3’ has been both open-ended and has involved the largest monthly amounts of debt monetization yet in absolute terms (with the sole exception of the massive alphabet soup programs initially launched in late 2008), there are basis effects to consider: when ‘QE2’ was launched in November of 2010, the total extant money supply was still a lot lower than it was when ‘QE3’ began in late 2012. In addition, bank lending growth has steadily declined since early 2012, so there was little impulse from inflationary lending on the part of commercial banks (very recently, growth in bank lending has picked up a bit).
Note that ‘Operation Twist’ did not directly influence the money supply, as it merely amounted to an altering of the maturity structure of the Fed’s securities portfolio.
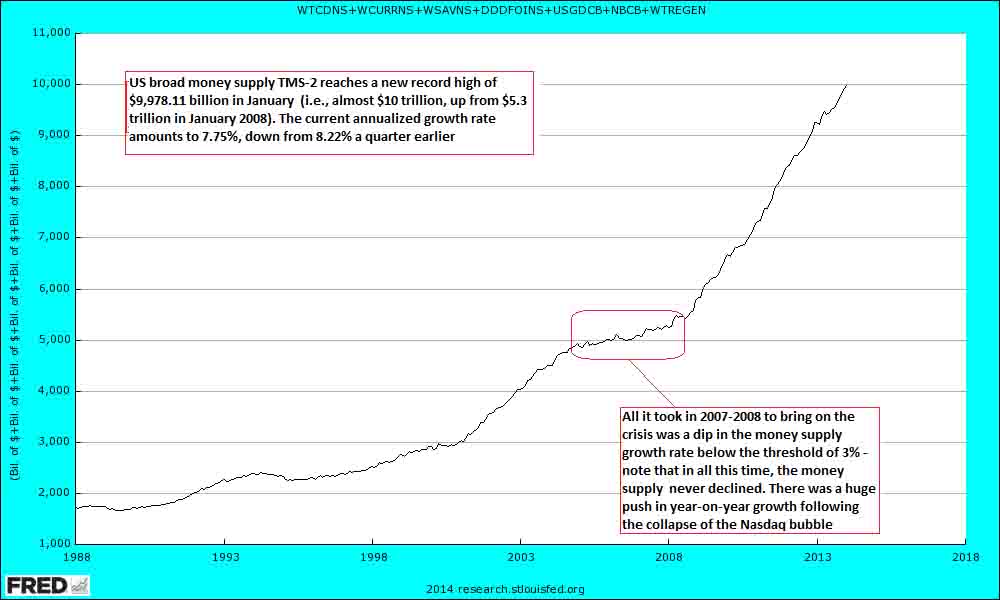
The most recent data show that the true broad US money supply has by now expanded to almost $10 trillion, with the year-on-year growth rate ticking up again slightly in January, but still remaining below the y/y growth rate recorded a quarter ago and a year ago. In short, the downtrend in the rate of growth in evidence since the end of ‘QE2’ has not really been interrupted. That may change if commercial banks increase their lending at a faster pace than the Fed reduces its securities purchases. While bank lending growth has indeed picked up since the ‘taper’ announcement, it is too early to come to conclusions about it, as it is a fairly recent phenomenon that may yet be reversed.
Note however that something along these lines actually happened in the UK: when BoE credit was expanded via ‘QE’, money supply growth actually declined initially. In the meantime however, there has been a big push in UK TMS growth, which briefly topped 10% last year. In this particular case it appears that various government interventions designed to restart the mortgage credit bubble have been quite effective in spurring lending, as the seemingly inexorable rise in UK property prices has resumed at full blast, with prices in London especially rising at a very fast pace.

US money TMS-2 – the ‘parabolic’ advance continues, but its growth momentum has actually decreased – click to enlarge.
Â

TMS-2, year-on-year growth rate. From late 2008 to late 2012, the annual growth rate only once briefly dipped below 10%. Since the end of ‘QE2’, it has however been in a steady downtrend – click to enlarge.
