A daily summary of global stock index price action & what caused it in Asia, Europe and the US- to help investors and traders of forex, stocks, indexes etc., get back into context for the week ahead in global financial markets
The following is a partial summary of the conclusions from the fxempire.com  fxempire.com ’ meeting in which we share thoughts about what’s driving major global asset markets. The focus is on global stock indexes as these are the best barometer of overall risk appetite and what drives it, and thus of what’s moving forex, commodities, and bond markets.
It’s a quick summary of last week’s international stock market action and what drove it. It’s our starting point for our follow up articles on:
- Lessons For The Coming Week And Beyond
- Coming Week Top Market Movers
- EURUSD Outlook
- Related Special Features: These vary each week depending on what’s happening. You’ll find them fxempire.com .
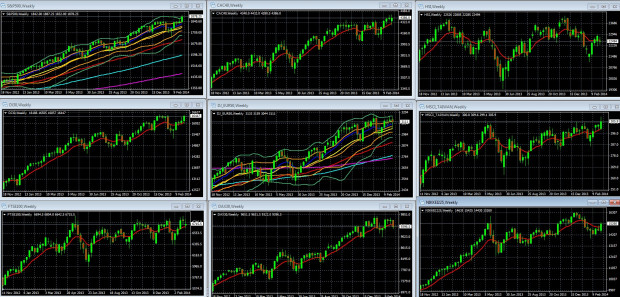
GLOBAL MARKETS IN A SINGLE IMAGE
The below is a sample of leading US, European, and Asian stock indexes’ weekly charts, which provide a quick look at risk appetite world-wide for the past 4 months.

Weekly Charts Of Sample Global Indexes November 11 2012 To Present
With 10 Week/200 Day EMA In Red: LEFT COLUMN TOP TO BOTTOM: S&P 500, DJ 30, FTSE 100, MIDDLE: CAC 40, DJ EUR 50, DAX 30, RIGHT: HANG SENG, MSCI TAIWAN, NIKKEI 225
FOR S&P 500 AND DJ EUR 50 Weekly Chart October 2012 – Present: 10 Week EMA Dark Blue, 20 WEEK EMA Yellow, 50 WEEK EMA Red, 100 WEEK EMA Light Blue, 200 WEEK EMA Violet, DOUBLE BOLLINGER BANDS: Normal 2 Standard Deviations Green, 1 Standard Deviation Orange
KEY: 10 Week EMA Dark Blue, 20 WEEK EMA Yellow, 50 WEEK EMA Red, 100 WEEK EMA Light Blue, 200 WEEK EMA Violet, DOUBLE BOLLINGER BANDS: Normal 2 Standard Deviations Green, 1 Standard Deviation Orange
Source: MetaQuotes Software Corp, www.fxempire.com, www.thesensibleguidetoforex.com
07 Mar. 09 03.49
Key Points
Continued upward momentum for global equities and by extension other risk assets. The last week shows risk appetite either rising or steady.
US and European indexes upward momentum remains strong, as indicated by their being in the upper “buy zone†of their double Bollinger bands.
DAILY RECAP TOP MARKET MOVERS
The following is a daily recap of top market drivers.
MONDAY: Russian Invasion of Crimea Slams Markets
Asian indexes were down hard [Japan -1.3%, Hong Kong -1.5%, China +0.9%, India -0.8%, Australia -0.33%, Korea -0.77%, Singapore -0.75%] on rising tensions in Ukraine. Adding to the negativity, China’s HSBC manufacturing PMI dropped to a seven-month low of 48.5 in February from 49.5 in January, while the official mfg PMI (focused more on large state-owned firms) slipped to 50.2 from 50.5. On the brighter side, the official non-manufacturing PMI rose from 53.4 to 50.2, perhaps a sign that government attempts to rebalance China’s economy are working.
