FX Traders’ weekly EURUSD fundamental & technical picture, this week’s market drivers that could change it- the bullish, the bearish and likely EURUSD direction & Putin’s song dedication to the West ( & Japan too).
The following is a partial summary of the conclusions from the fxempire.com  fxempire.com ’ meeting in which we cover the key lessons learned for the coming week and beyond.
Overview
- TECHNICAL OUTLOOK
- Weekly
- Daily
- FUNDAMENTAL OUTLOOK
TECHNICAL OUTLOOK
First we look at the longer term view from the weekly chart below.

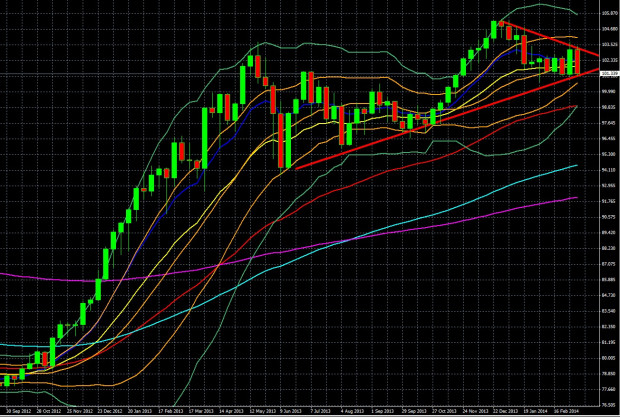
Weekly USDJPY Chart February 19 2013 to March 14 2014.
KEY: 10 Week EMA Dark Blue, 20 WEEK EMA Yellow, 50 WEEK EMA Red, 100 WEEK EMA Light Blue, 200 WEEK EMA Violet, DOUBLE BOLLINGER BANDS: Normal 2 Standard Deviations Green, 1 Standard Deviation Orange
Source: MetaQuotes Software Corp, www.fxempire.com, www.thesensibleguidetoforex.com
04 Mar. 16 15.25
USDJPY Weekly Chart Key Points To Note: Short Term Bearish, Medium Term Neutral
- Bullish Pennant Pattern: Convergence of the longer term uptrend and shorter term downtrend forms a “pennant†chart pattern. It’s a continuation pattern and so given the former steep uptrend, it suggests a coming bullish breakout from the recent trading range that awaits confirmation by a move higher.
- Neutral Momentum on Weekly Chart: The pair remains stuck in its DOUBLE BOLLINGER BANDS, suggesting more flat range bound trading with momentum stuck in neutral.
- Key Levels To Watch: See daily chart and commentary below for likely coming week key support and resistance levels.
USDJPY Daily Chart Key & Points To Note

Daily USDJPY Chart November 10 2013 to March 14 2014.
KEY: 10 Week EMA Dark Blue, 20 WEEK EMA Yellow, 50 WEEK EMA Red, 100 WEEK EMA Light Blue, 200 WEEK EMA Violet, DOUBLE BOLLINGER BANDS: Normal 2 Standard Deviations Green, 1 Standard Deviation Orange
Source: MetaQuotes Software Corp, www.fxempire.com, www.thesensibleguidetoforex.com
05 Mar. 16 16.06
- Short Term Bearish, Medium Term Neutral
- Downward Bearish Momentum On Daily Chart Below: Given the pair’s 4 consecutive days’ lower closings; it’s firmly in the DOUBLE BOLLINGER BANDS, suggesting sustainable downside for those seeking to open new short positions. The 10, 20, and 50 day EMAs are also turning downwards. As with stocks, this reflects the effects of the Crimean crisis and latest batch of weak China data that drove risk asset markets down hard last week.
- Key Levels To Watch:
- The pair closed last week at strong support around 101.34 (both the price level and weekly uptrend line serving as dual support), returning its monthly lows.
- A break below this level opens the way for a test of the 50% fib level around 101, then 100.80. After that there’s nothing until the 200 day EMA around100.75
- It would take a confirmed break above resistance at the 23.6% fib level around103.35 to re-establish the uptrend on the daily chart.
