Part 1 Is An Introduction To Double Bollinger Bands, Part 2 (coming tomorrow) Is A Continuation That Presents Specific Rules And Examples, Part 3 (coming in two days) Is A Quick Summary
This is part of Part 2 continuing series of special features on trader education, and provides a solid basis for understanding double Bollinger bands. For more detailed coverage and examples, see Chapter 8 of the book, The Sensible Guide To Forex.
Double Bollinger Bands (DBBs) are arguably the single most useful technical indicator. Although you shouldn’t rely on just one indicator, DBBs are among the first indicators that one should check. They tell us:
- When a trend is strong enough to continue riding or to enter new positions even if it has been going on for a long time, even at historical highs or lows where there are neither support nor resistance (s/r) points for reference.
- When there is no clear trend and you need to either stand aside or switch from a trend-following system to a range-trading system.
- When it’s time to take profits or to get ready to trade the reversal.
You don’t have to take my word for it.
In her book, The Little Book of Currency Trading, rock-star forex analyst Kathy Lien writes:
Of the hundreds of technical indicators out there, the Double Bollinger Bands are hands down my favorite…they provide a wealth of actionable information. They tell me whether a currency pair is in a trend or range, the direction of the trend, and when the trend has exhausted. More importantly, Bollinger Bands also identify entry points and proper places to put a stop.
While Ms. Lien refers above to currency trading, like most technical indicators, DBBs can be applied to technical analysis for any actively traded asset traded on big liquid markets like stocks, commodities, bonds, etc.
To create them on your chart:
- First insert a standard set of Bollinger bands: Select the Bollinger bands option from your menu of indicators and for your settings select 2 standard deviations and 20 periods. That means you’ve selected a 20 period simple moving average (SMA) and 2 lines or Bollinger bands that move lock-step with it, at a distance of 2 standard deviations.
- Then, insert a second set of Bollinger bands: Repeat the above process, the only difference is that you select 1 standard deviation distance from your 20 period SMA. Consult your charting platform’s help menu if the process is unclear.
For those without a statistics background, just know that for purposes of this discussion, standard deviations function as units of distance from the 20-period simple moving average (SMA), which is both the center line between the four DBBs and thus the baseline for determining the location of the 1 and 2 standard deviation Bollinger bands. If you want to know to know more about them, you can either search out the details online, or find further explanations in my book in chapters 4 and 8.
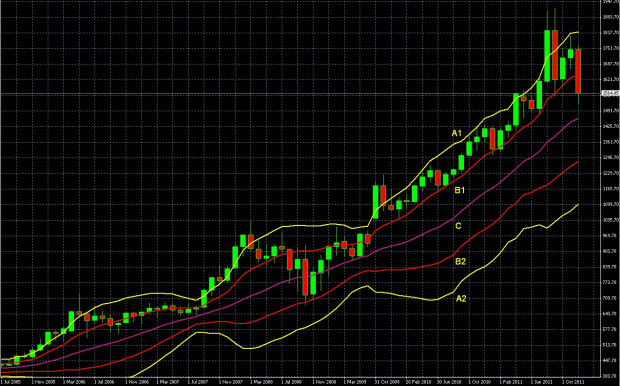
See Chart 1 below for an example of what DBBs look like.

Chart 1: Gold Monthly Chart July 2005 to December 2011
Source: book (p.228), MetaQuotes Software Corp    (fig8.2)
