Part 1Â Is An Introduction To Double Bollinger Bands, Here, Part 2, Is A Continuation That Presents Specific Rules And Examples
This is part of FXEmpire’s continuing series of special features on trader education, and provides a solid basis for understanding double Bollinger bands. For more detailed coverage, and examples, see Chapter 8 of the book, The Sensible Guide To Forex, or its video course version on fxacademy.com here.
The Four Rules for Using Double Bollinger Bands (DBBs) & Examples
Here’s a summary of how to actually use and apply Double Bollinger Bands (DBBs).
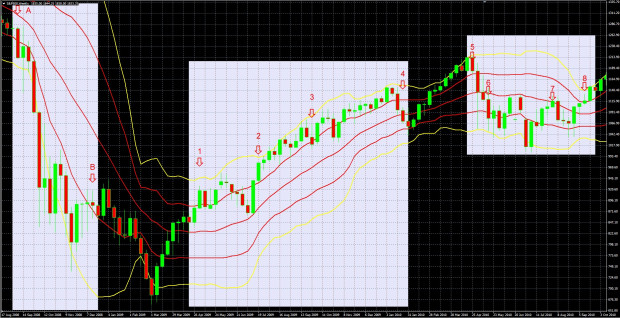
We’ll be referring to different parts of Chart 2 below, a weekly chart of the S&P 500, which covers the period from August 17, 2008 to October 3 2010.
DBBs work in any time frame, although like other technical indicators, their signal is more meaningful in longer time frames in which random short term noise and money don’t distort the real trend.

CHART 2: S&P 500 Weekly Chart August 17, 2008 to October 3 2010
Source: MetaQuotes Software Corp, www.fxempire.com, www.thesensibleguidetoforex.com
14 Feb. 19 19.58
RULE 1: Go Short Or Stay Short When Price Is In Or Below The DBB “Sell Zone†(DBBSZ)
The DBB Sell Zone (DBBSZ) is the bottom area bounded by the lower red and yellow Bollinger bands
As long as price remains within or below the lower 2 BBs, the downward momentum is strong enough to trust, so that there is a high probability that the trend will continue. When price drops into this area, it is a signal (pending confirmation, as per Part 1) to enter new short positions, and to maintain them until price makes a decisive (confirmed) move above this zone. Exit and take profits when price makes a decisive move above this zone.

CHART 3: S&P 500 Weekly Chart Sept. 7th – Dec. 14th 2008 – Framed By Arrows A and B Within Highlighted Area
Source: MetaQuotes Software Corp, www.fxempire.com, www.thesensibleguidetoforex.com
01 Feb. 25 20.10
For example in Chart 3 above (a magnified version of the left side of Chart 2 above) from the week of September 7th (arrow A) until the week of December 14th (arrow B), the odds favored maintaining short positions for those trading off weekly charts.
Get Confirmation
Because the downtrend needs strong momentum to enter the buy or sell zones, Double Bollinger Bands are distinctly lagging indicators and thus by themselves not suited for catching short-lived though perfectly tradable trends. As noted in Part 1, you’ll want some additional technical confirmation, and at times will need to focus on developing news that could become market moving. Politically driven events can be especially unpredictable and merit extra caution.
For example, if you would have solely relied on DBBs during the Greek stage of the EU debt crisis that occurred in the spring of 2010, you would not have gone short the index until the trend was mostly finished, as shown in Chart 4 below.

CHART 4: S&P 500 Weekly Chart April 25 – August 1, 2010 – Framed By Arrows 5 And 7 Within Center Highlighted Area
Source: MetaQuotes Software Corp, www.fxempire.com, www.thesensibleguidetoforex.com
02 Feb. 25 21.29
As with any breakout move, you need to have your criteria for distinguishing between a decisive break above the DBBSZ, and a false breakdown such as the choppy price action we see from candles 6 to 7 in Chart 4 above. Those criteria for defining a sustained move can be as simple as a given number of candlesticks that stay above the DBBSZ, or a more complex combination of indicators like a moving average crossover.
RULE 2: Go Long, Stay Long, When Price Is In Or Above The DBB “Buy Zone†(DBBBZ)
The DBB Buy Zone (DBBBZ) is the top area or quarter, in bounded by the upper red and yellow Bollinger bands
As long as price remains within or above the upper 2 DBBs, the upward momentum is strong enough so that there is a high probability that the trend will continue higher. This is the time to enter new long positions. Exit and take profits when price moves below this zone.

