FX Traders’ weekly EURUSD fundamental & technical picture, this week’s market drivers that could change it- the bullish, the bearish and likely EURUSD direction.
The following is a partial summary of the conclusions from the fxempire.com weekly analysts’ meeting in which we cover outlooks for the major pairs for the coming week and beyond.
Summary
- Technical Outlook: Near term neutral, longer term bullish
- Fundamental Outlook: Neutral Near Term, Bearish Longer Term
- Trader Positioning: Reminiscent Of The Last Big EURUSD Pullback Per Two Surveys
- Conclusions: Some potentially potent drivers, however the big moves likely not until the following weeks & Why
TECHNICAL OUTLOOK
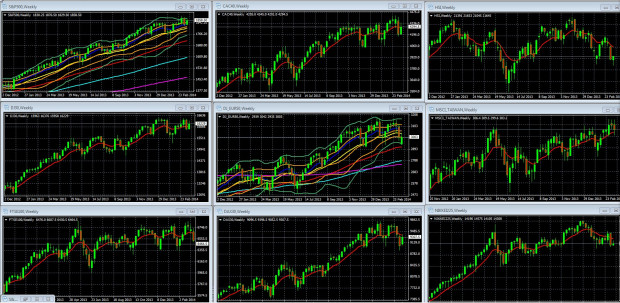
First we look at overall risk appetite as portrayed by our sample of global indexes, because the EURUSD has been tracking these fairly well recently.
Overall Risk Appetite: Sample Global Weekly Chart & Key Take-Aways
Our sample of weekly charts for leading global stock indexes suggests a mixed technical picture, with the US locked in a tight 5 week trading range but retaining its upward momentum, while Europe and Asia have pulled back in recent weeks under the combined weight of the Crimean situation and China slowdown fears exacerbated by what’s becoming weekly corporate bond defaults and weak data.

Weekly Charts Of Large Cap Global Indexes With 10 Week/200 Day EMA In Red: LEFT COLUMN TOP TO BOTTOM: S&P 500, DJ 30, FTSE 100, MIDDLE: CAC 40, DJ EUR 50, DAX 30, RIGHT: HANG SENG, MSCI TAIWAN, NIKKEI 225
KEY: 10 Week EMA Dark Blue, 20 WEEK EMA Yellow, 50 WEEK EMA Red, 100 WEEK EMA Light Blue, 200 WEEK EMA Violet, DOUBLE BOLLINGER BANDS: Normal 2 Standard Deviations Green, 1 Standard Deviation Orange
Source: MetaQuotes Software Corp, www.fxempire.com, www.thesensibleguidetoforex.com
01 Mar. 22 20.49
Key Take-Aways
Risk appetite, as portrayed by these weekly index charts, stabilized this week. That’s not surprising given that both military actions and sanctions have been within expectations, so fears of further escalation remain real but subdued. Overall, European indexes actually climbed throughout the week as this idea became more widespread.
The muddied overall risk appetite picture isn’t helpful this week, so we look to the weekly EURUSD chart
EURUSD Weekly Technical Outlook: Neutral On Daily Chart, Bullish on Weekly Chart
The weekly chart shows the pair pulled back, and the daily chart clarifies why.

EURUSD Weekly Chart, 2 June 2013 – 21 March 2014
KEY: 10 Week EMA Dark Blue, 20 WEEK EMA Yellow, 50 WEEK EMA Red, 100 WEEK EMA Light Blue, 200 WEEK EMA Violet, DOUBLE BOLLINGER BANDS: Normal 2 Standard Deviations Green, 1 Standard Deviation Orange
Source: MetaQuotes Software Corp, www.fxempire.com, www.thesensibleguidetoforex.com

