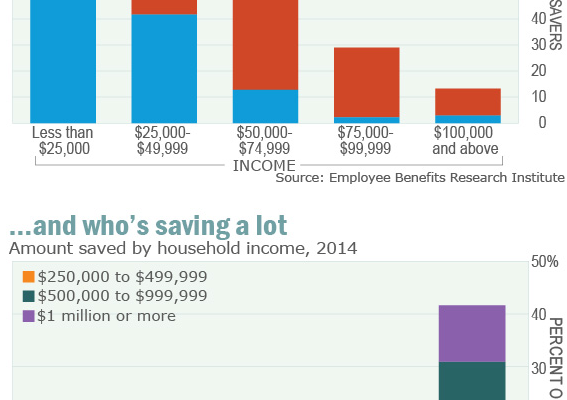
In the land of the free and the home of the entitled, the sad (but true) nature of income inequality’s inexorable rise in the past few years has a somewhat more startling impact on the future. With work being punished for the marginal employee and the wealth effect concentrated in the hands of the great and good, the following two charts show clearly the sad fact that those who need to save for the future the most don’t (and likely can’t) and those with all the income save the most (and thus ‘spend’ the least). As we noted previously, the rich have the assets and the poor have the debt (and debt is not wealth)
.
As following two charts, a recent study shows that 36% of Americans had saved $1,000 or less for retirement.
The following charts show just how intensely the problem of scanty retirement savings is concentrated among lower earners.
Among households that earn less than $25,000 a year, around 75% have less than $1,000 saved, and almost 95% have less than $25,000.
Once you get to the middle income range, the outlook brightens a little: About half of all households earning between $50,000 and $75,000 have at least $25,000 put away, and around 20% of that group have saved at least $100,000.
Among six-figure earners, as you’d expect, the retirement balances look healthier still: More than 40% have saved at least $250,000, and 10% have saved at least $1 million.
…
Of course, just because you’re earning well doesn’t mean you’re saving much;about 12% of this high income group has saved less than $25,000 for retirement.Â

So there it is – those that need to save can’t (or won’t) and those that don’t need to save do… so why again is Fed policy aimed at pumping up the assets of the wealthy (who are relative over-savers and under-consumers) in an economy reliant on the marginal consumer to bring home the bacon for everyone?

