While it wasn’t in an overly dramatic fashion, the market lost a little ground last week.  The loss, however, isn’t the troubling part.  The troubling part is the way in which stocks retreated, and what the bulls weren’t able to do when then they took their shot on Thursday and Friday.
We’ll highlight those red flags in a second. Â First, let’s set the context by dissecting last week’s major economic numbers.Â
Economic Calendar
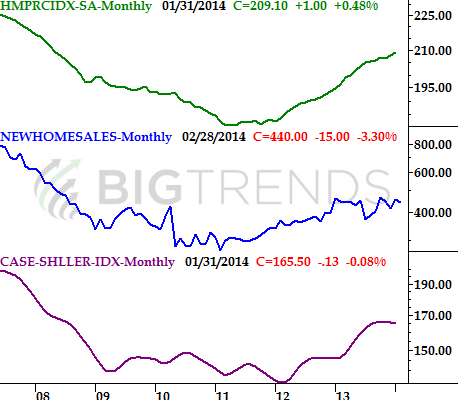
We got more than a little bit of economic data last week, though only a small piece of it was important.  Among the “important” numbers were the wave of housing and real estate data we heard early on in the week.  In a word, the real estate picture continues to look… mixed.
How so? Â The Case-Shiller Index was up 0.8% on a year-over-year, seasonally-adjusted basis (though down a bit from December), the FHFA said its housing price index grew 0.5% for January, and the Census Bureau reported that new home sales for February fell to 440K, down from January’s pace of 455K. Â Paired with the previous week’s mixed data (permits, starts, and existing homes sales were up, flat, and down, respectively), we can safely say that the real estate and construction market are quite mediocre, having flattened out in most cases.Â
Case-Shiller and FHFA Home Price Indexes Chart
Source: Â U.S. Census Bureau and the National Association of Realtors
Pending home sales (not plotted on our chart) slipped 0.8% in February, making the real estate picture even fuzzier.
Consumer sentiment is also a mixed bag.  The Conference Board’s consumer conference reading rose from 78.3 to 82.3 for March, while the Michigan Sentiment Index fell from 81.6 to 80.0.  Much like the housing and construction market data, the consumer opinion data continues to give us a mixed message.
Michigan Sentiment and Conference Board Consumer Confidence Chart

