FX Traders’ weekly EURUSD fundamental & technical picture, this week’s market drivers that could change it- the bullish, the bearish and likely EURUSD direction short, medium, long term
The following is a partial summary of the conclusions from the fxempire.com  fxempire.com ’ meeting in which we cover outlooks for the major pairs for the coming week and beyond.
Summary
- Technical Outlook: Weekly Neutral, Daily Bearish, At Clear Technical Crossroads
- Fundamental Outlook: Short Term Neutral, Longer Term Bearish
- Trader Positioning: Our real time sample shows growing long positions as EURUSD falls-bearish on a weekly basis
- Conclusions: Currently at crossroads as strong support of the 1.37 level has held. If it breaks a test of the 1.36 level is likely. If support holds, upside for the coming week limited to around 1.3750 – 80.
- Monthly Chart Shows EURUSD at long term crossroads, though likely longer term USD rate advantage suggests the long term downtrend ultimately prevails
- TECHNICAL OUTLOOK
First we look at overall risk appetite as portrayed by our sample of global indexes, because the EURUSD has been tracking these fairly well recently.
Overall Risk Appetite Per Leading Global Stock Indexes Weekly Charts: Bullish
Our sample of weekly charts for leading global stock indexes suggests continued steady-higher indexes, risk appetite.Â
EURUSD Weekly Outlook: At Short, Long Term Crossroads, & What Will Decide Its Fate
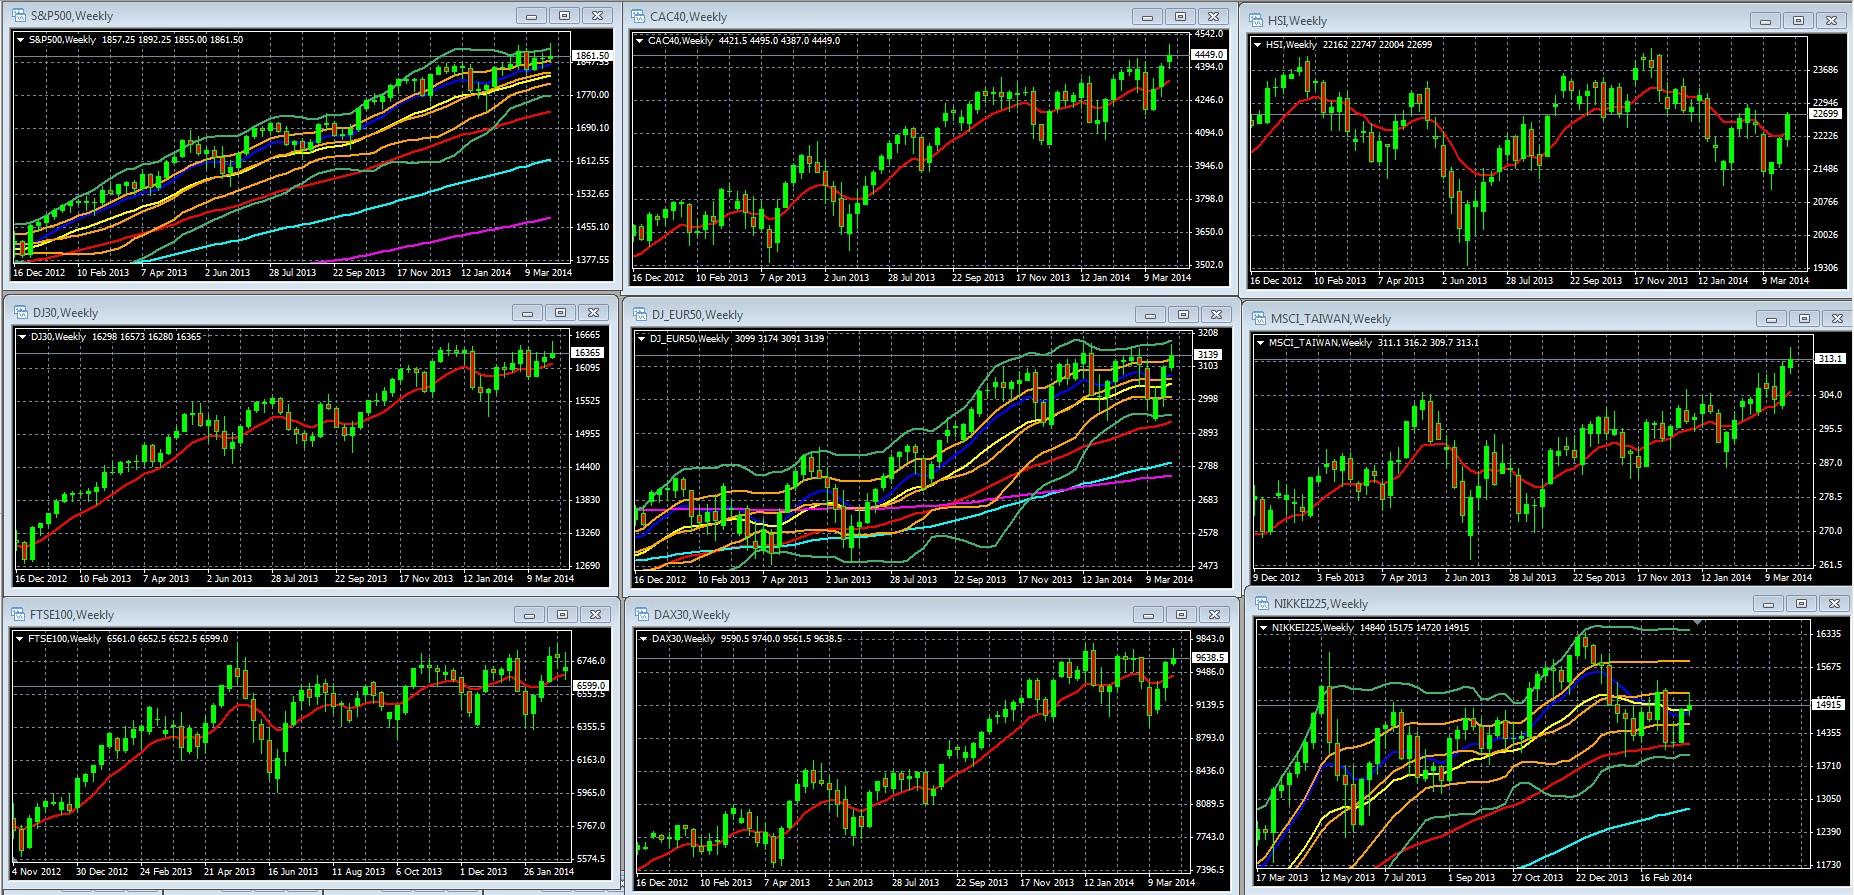
 Weekly Charts Of Large Cap Global Indexes With 10 Week/200 Day EMA [DATES] In Red: LEFT COLUMN TOP TO BOTTOM: S&P 500, DJ 30, FTSE 100, MIDDLE: CAC 40, DJ EUR 50, DAX 30, RIGHT: HANG SENG, MSCI TAIWAN, NIKKEI 225
Key For S&P 500, DJ EUR 50, Nikkei 225 Weekly Chart: 10 Week EMA Dark Blue, 20 WEEK EMA Yellow, 50 WEEK EMA Red, 100 WEEK EMA Light Blue, 200 WEEK EMA Violet, DOUBLE BOLLINGER® BANDS: Normal 2 Standard Deviations Green, 1 Standard Deviation Orange.
Source: MetaQuotes Software Corp, www.fxempire.com, www.thesensibleguidetoforex.com
04 Apr. 05 21.24
Key Take-Aways Weekly Chart: Bullish
US and European indexes were not only up last week, but also the European indexes overall moved back into (or at least closer to) the double Bollinger band buy zones, so long term risk appetite momentum is strong enough for the odds to favor further gains. Barring any potent EUR or USD news, the EURUSD tends to track overall risk appetite, particularly the S&P 500.
EURUSD Weekly & Daily Technical Outlook: Weekly Neutral, Daily Bearish, At Clear Technical Crossroads
Summary: Neutral longer term (weekly chart), bearish near term (daily chart). Currently at crossroads as strong support of the 1.37 level has held. If it breaks this week, a test of the 1.36 level is likely. If support holds, upside for the coming week per technical data is likely limited to around 1.3750 – 80, the upper end of the new descending channel formed by the past 3 weekly candles.

EURUSD Weekly Chart March 31- April 4 2014 Highlighted With Red Arrow
KEY: 10 Week EMA Dark Blue, 20 WEEK EMA Yellow, 50 WEEK EMA Red, 100 WEEK EMA Light Blue, 200 WEEK EMA Violet, DOUBLE BOLLINGER® BANDS Normal 2 Standard Deviations Green, 1 Standard Deviation Orange
Source: MetaQuotes Software Corp, www.fxempire.com, www.thesensibleguidetoforex.com
05 Apr. 05 21.33
Key Take-Aways Weekly Chart: Neutral But At Major Technical Crossroads
-The pair suffered its third straight down week, creating a steep downtrend
-It remains within the double Bollinger band neutral zone, so momentum is neutral, so we don’t have a reliable trend on the weekly charts.
However strong support of the 1.3700 level held. Note that this level has multiple levels of support, including:
