Watch What They Do, Not What They Say
On Wednesday Kremlinologists were treated to the bizarre spectacle of the release of the Fed minutes (abridged version) again. It has recently been argued that the market has been buffeted by alternately being led to believe that administered interest rates may rise sooner than expected (Ms. Yellen hinted in her March press conference at ‘6 months after QE ends’), or later than expected (she corrected herself on a subsequent occasion).
The Fed minutes released yesterday seemed to indicate – at least that was the interpretation, i.e., the effect of market participants hearing what they wanted to hear – that ‘later’ it shall be. Surprise, surprise, the Fed is dovish! Who would have thought? What an unexpected turn of events!
However, people already know (or should know) that the central bank will forever err in favor of easy monetary policy. When was the last time it has done otherwise? That was a brief period most of today’s market participants don’t even remember, namely 1979-1980. The Fed is always reactive, and as such it remains perennially ‘behind the curve’. What is discussed in its meetings today is meaningless – it has precisely zero bearing on its policy decisions of tomorrow.
In short, what they say is irrelevant. From the perspective of market participants, the only thing worth doing is to watch the rate of growth of the money supply (money proper + circulation credit). With regard to this a trend could be observed over the past 30 years: it takes an ever lower level of short term interest rates to arrest money supply growth. Moreover, since the commercial banking system’s de facto insolvency was unexpectedly and suddenly revealed in 2008, money supply growth has become almost entirely dependent on the Fed’s deployment of ‘extraordinary policy measures’, this is to say, quantitative easing (a.k.a. outright money printing).

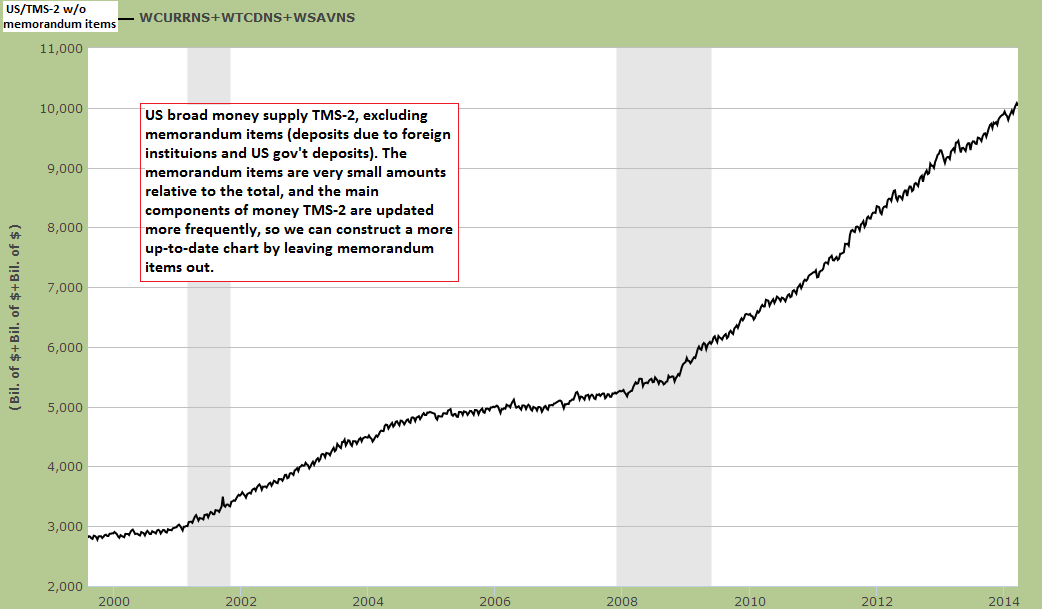
The broad US money supply TMS-2, excluding memorandum items. The difference is very small, as memorandum items amount to very little relative to the total. In this way we can construct a more up-to-date chart, as the main components of TMS-2 are updated on a weekly basis -click to enlarge.

Recent gyrations in treasury note yields of various maturities (10,5 and one year) in reaction to various Fed statements. The chart at the bottom shows the ratio of the 10 year to the one year note yield, a measure of whether the yield curve is flattening or steepening -click to enlarge.
The Debtberg’s Legacy
How can it be explained that money supply growth has tended to falter at ever lower levels of interest rates?
The amount of outstanding unproductive debt has grown exponentially since the adoption of a pure fiat money system in the wake of Nixon’s 1971 gold default. This legacy debt load needs to be serviced, and the larger it becomes, the more onerous debt service costs will be at a given level of interest rates.

US total credit market debt – the bigger this debtberg becomes, the more difficult servicing the debt is at a given level of interest rates -click to enlarge.
