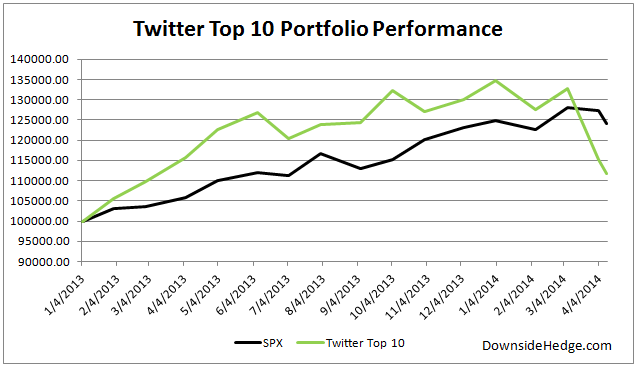
The Twitter Top 10 portfolio is down 2.91% since the new picks last week. This is slightly worse performance than the S&P 500 Index (SPX) which is down about 2.4%. Â The under performance is mostly a result of Kandi Technologies (KNDI) which is down nearly 12%. Six of the stocks in the portfolio are performing better than SPX as the portfolio rotated to larger cap stocks when momentum stocks failed.
Below is a performance chart and details of the current holdings.

| Start Date | Symbol | Shares | Start Price | Start Total | End Price | End Total | % Gain / Loss |
| 4/4/2014 | $MSFT | 292 | 39.87 | 11642.04 | 39.35 | 11490.20 | -1.30% |
| Â | $HIMX | 1021 | 11.43 | 11670.03 | 10.61 | 10832.81 | -7.17% |
| Â | $GTAT | 761 | 16.90 | 12860.90 | 16.26 | 12373.86 | -3.79% |
| Â | $QCOM | 148 | 78.53 | 11622.44 | 78.11 | 11560.28 | -0.53% |
| Â | $BIDU | 73 | 149.35 | 10902.55 | 149.02 | 10878.46 | -0.22% |
| Â | $KNDI | 687 | 14.08 | 9672.96 | 12.40 | 8518.80 | -11.93% |
| Â | $F | 724 | 16.13 | 11678.12 | 15.74 | 11395.76 | -2.42% |
| Â | $AA | 925 | 12.63 | 11682.75 | 12.40 | 11470.00 | -1.82% |
| Â | $K | 183 | 63.77 | 11669.91 | 65.33 | 11955.39 | 2.45% |
| Â | $GMCR | 113 | 102.99 | 11637.87 | 99.28 | 11218.64 | -3.60% |
| Â | Cash | Â | Â | 116.05 | Â | 116.05 | Â |
| Â | Â | Â | Â | Â | Â | Â | Â |
| Totals | Â | Â | Â | 115155.62 | Â | 111810.25 | -2.91% |
The StockTwits Top 10 portfolio continues to fall with the market. It is down 3.75% from last week’s new picks. The slide in relation to the S&P 500 Index (SPX) isn’t as severe as the March carnage due to some rotation to large cap and more defensive stocks.  Over half the stocks are down less than about 2%.  These stocks are holding up better than SPX. The one large laggard this month is SunPower (SPWR) which is down nearly 16% which accounts for much of the under performance.

