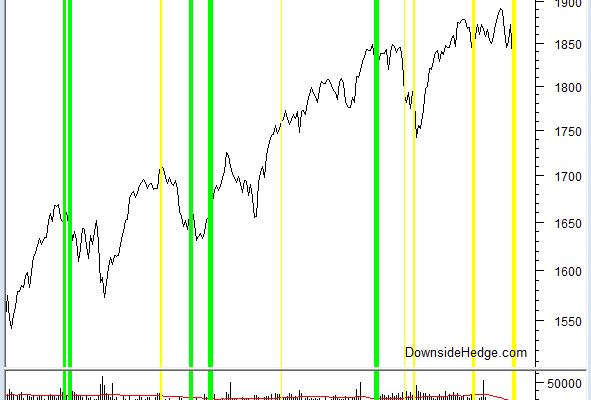
This past week our core market health indicators continued their recent trend.  All of them except for our measures of the economy fell. Our measures of trend fell sharply and ended the week well below zero.  As a result, we’re raising more cash and/or adding a larger hedge to our core portfolios.  By the close today our Long/Cash portfolios allocations will be 20% long and 80% cash.  Our hedged portfolio will be 60% long stocks that we believe will out perform the market in an uptrend and 40% short the S&P 500 Index (SPX) (or use the ETF SH).  Below is a chart of our portfolio changes over the past year.  The yellow lines represent raising cash/adding hedges.  The green lines represent removing hedges and adding more longs to the portfolios.

As I pointed out a few weeks ago, historically our indicators deteriorating to these levels have resulted in an extended choppy market or an extended decline 65% of the time. Â 35% of the time these conditions marked a short term low and the market resumed its uptrend within a few weeks. Â The odds favor being cautious at the moment.
One other thing to note is that our measures of perceived risk are rising, but not quickly.  This taken with our other indicators suggests that the market is undergoing systemic changes that aren’t causing extreme concern from market participants.  So far the selling has been controlled, but we’re getting near the point where the market needs to bounce or fear could start an escalation of selling.  I suspect the 1800 area on SPX will be a large test that will mark the boundary between churning and panic.  As always, we’ll update the site if conditions change.
Below is a chart with our core indicator category readings.

The post Raising Cash and Adding More Hedge appeared first on Downside Hedge.

