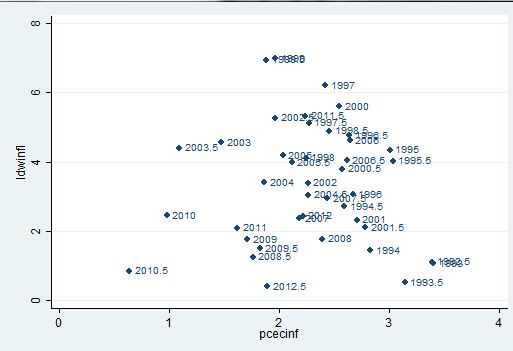
Yesterday, I noted that an expectations un-augmented Phillips curve fits data from the past two decades rather well. Here is an even simpler illustration of the point that lagged price inflation has not correlated with wage inflation for the past two decades.

The figure is a scatter of lgwinfl — the percent annual rate of increase of
Business Sector: Compensation Per Hour (HCOMPBS), Index 2009=100, Semiannual, Seasonally Adjusted from FRED on pcecinf the lagged annual percent rate of JCXFE “Personal Consumption Expenditures: Chain-type Price Index Less Food and Energy (JCXFE), Index 2009=100, Semiannual, Seasonally Adjusted.â€
Note that the data are of semiannual frequency, so each raw data point from FRED affects two overlapping intervals and therefore two dots on the graph. I look at data for intervals starting from the second half of 1992 through the second half of 2012 (the most recent available). The labels refer to the start of the intervals.
There is no sign of an effect of lagged price inflation on wage inflation. As noted by Nick Rowe in comments, this is what one might expect if the Fed were successfully targeting inflation. In that case the best estimate of future price inflation would be the target no matter what inflation had recently been. (Actually now that I think about it, current new Keynesian models still suggest a correalation as sticky wages catch up with other than expected price growth. But that’s not the point of this post.)
This is what central bankers and other people mean when they say that inflation expectations are anchored — they mean changes in price inflation don’t persist, because they don’t feed over into wages. However, anchored expectations can also be a statement about expectations. A lack of feedback to wages might be due to something else — Krugman argues that it can occur if there is downward nominal wage rigidity.
I have noted that lagged inflation is correlated with the breakeven inflation rates which would make the return on Treasury Inflation Protected Securities (TIPS) equal to the return on ordinary nominal Treasury Securities. This post looks at 5 year breakevens which should reflect expected inflation over the next five years. Bond traders’ expectations sure don’t seem to be anchored.

