Methodology
Our weekly best and worst reports show you stocks with the best potential returns over the coming 6 to 12 months. The score is calculated by fusing together the key drivers of price movement including, earnings beats, earnings growth, at-the-market insider buys, institutional activity, short ratio analysis, price to earnings analysis and calendar quarter seasonality. Those stocks appearing in our best list should be bought while those appearing in our worst list should be sold.
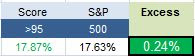
The highest scoring names in large cap from 1 year ago returned an average 17.87% in the past year. Performance has been led MGA up 70%, NOC up 68%, HAL up 47%, BA up 43%, and ORLY up 42%.

- The top large cap sector is utilities.
- Industrial metals & minerals is the top industry.
The average large cap score is 54.69 this week, below the four week moving average score of 57.87. The average large cap is trading -12.27% below its 52 week high, 0.90% above its 200 dma, has 4.1 days to cover short, and is expected to post EPS growth of 14.01% next year.
Â
The best large cap sector is utilities, which offer robust seasonality ahead of summer. Basic materials have strengthened thanks to improving scores for oil & gas. Industrial goods also score above average and benefit from recovery in Europe. Consumer, healthcare, and technology score in line. Services and financials score below average.
Â

