Yesterday Amazon reported its latest numbers which, as one would expect, emphasize the future and the profit potential one, two or more decades in the future, instead of highlighting the present and certainly the recent past. Because, neither the present nor the recent past are pretty.
In a nutshell: in Q1 Amazon posted a tiny beat on revenues, with Q1 sales printing at $19.7 billion compared to $19.4 billion estimated, however this is as good as it went. The problem as everyone knows for Amazon, are its margins. And in Q1 operating margins tumbled once again, this time to 0.7% (see chart below) which in turn resulted in operating income of only $146 million, well below the $200 million expected. And the cherry on top: AMZN guided to a Q2 operating loss between $455 million and $55 million, compared to the estimated profit of $210 million. Oh well, any decade now.
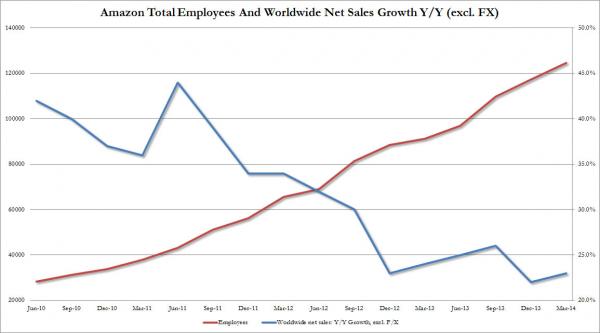
Here are Amazon’s result in 6 simple charts.
First, total employees and worldwide revenue growth:

Quarterly operating and net income by quarter:

And Amazon LTM operating margin. It just printed at its all time joint low:

Quarterly operating margin:

A historical snapshot of just the first quarter across the past five years:

And the punchline: Q1 margin. No commentary necessary


