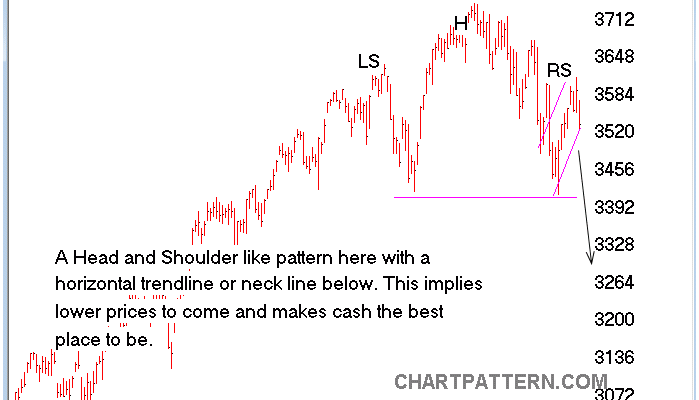
What total BS this market is. Â
NDX fell all the way to 3,480 yesterday but finished the day at 3,556, recovering 76 points (2%) in two hours.  Hey, a few more days of gains at that rate and we’ll be well over the 1999 highs – GO MARKETS!!! Â

Of course, as you can see from this chart (many more like this over at our Chart School), it’s going to take a lot more than a little 2% stick-save to stop that nasty “Head and Shoulders” pattern from hitting the dreaded “knees and toes” range. Â
On the bright side, there was decent volume on yesterday’s reversal, but that was only compared to the incredibly low volume of the previous run-ups. Â SPY volume was 135M, the biggest day since 4/15 by 30%+. Â If we do get follow-through to the upside today, we do need to take it seriously. Â As you can see from our Big Chart, the Nasdaq and the Russell are still in serious trouble:

The Russell was only saved by the 200 dma at 1,112 yesterday and fell all the way down to test our 10% line at 1,100, where we barely held up in February.  This is what’s keeping us from adjusting our 5% levels higher, the RUT keeps threatening to add a red box and the Dow simply cannot get over of it’s 5% line (though it has avoided failing the Must Hold line, so far). Â
 As you can see from this WSJ chart, the Russell 2000 is trading at a fairly ridiculous 36 times trailing earnings – even with the recent sell-off.  Going forward, they project to be at 20 times earnings but I’m not seeing any actual evidence that profits will be rising 44% this year, are you?  That’s what it takes to change a 36 p/e into a 20 p/e but PLEASE – don’t confuse traders with facts, right? Â
The 20-year average for the Russell, including the runaway valuations of 1999 and 2007, is 16.9 so 36 is more than double the average valuation. Â Small cap stocks (under $1Bn in valuation) aren’t even benefiting from the Fed’s Free Money Party the way the S&P 500 are and, in fact, they are being put at a competitive disadvantage in most markets.Â

