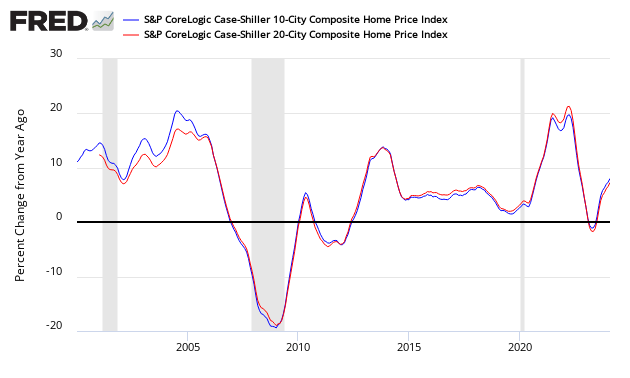
The non-seasonally adjusted Case-Shiller home price index (20 cities) for February 2014 (released today) rate of growth declined again slightly but showed the 21st consecutive monthly year-over-year gain in housing prices since the end of the housing stimulus in 2010.

- Home price rate of growth decelerated 0.3% month-over-month.
- Home prices increased 12.9% year-over-year (20 cities).
- The market had expected a year-over-year increase for the 20 city non-seasonally adjusted index of 13.2% to 14.0% (consensus 13.3) versus the 12.9% reported.
- Case-Shiller continues to show the highest year-over-year home price gains of any home price index.
S&P/Case-Shiller Home Price Indices Year-over-Year Change

Comparing all the home price indices, it needs to be understood each of the indices uses a unique methodology in compiling their index – and no index is perfect. The National Association of Realtors normally shows exaggerated movements which likely is due to inclusion of more higher value homes.
Comparison of Home Price Indices – Case-Shiller 3 Month Average (blue line, left axis), CoreLogic (green line, left axis) and National Association of Realtors 3 Month Average (red line, right axis)

/images/z existing3.PNG
The way to understand the dynamics of home prices is to watch the direction of the rate of change. Here almost universally (CoreLogic is currently accelerating) – home price growth is now decelerating.
Year-over-Year Price Change Home Price Indices – Case-Shiller 3 Month Average (blue bar), CoreLogic (yellow bar) and National Association of Realtors 3 Month Average (red bar)

/images/z existing5.PNG
There are some differences between the indices on the rate of “recovery†of home prices.Â
A synopsis of Authors of the Leading Indices:
Case Shiller’s David M. Blitzer, Chairman of the Index Committee at S&P Indices:
Prices remained steady from January to February for the two Composite indices. The annual rates cooled the most we’ve seen in some time. The three California cities and Las Vegas have the strongest increases over the last 12 months as the West continues to lead. Denver and Dallas remain the only cities which have reached new post-crisis price peaks. The Northeast with New York, Washington and Boston are seeing some of the slowest year-over-year gains. However, even there prices are above their levels of early 2013. On a month-to-month basis, there is clear weakness. Seasonally adjusted data show prices rose in 19 cities, but a majority at a slower pace than in January.
Despite continued price gains, most other housing statistics are weak. Sales of both new and existing homes are flat to down. The recovery in housing starts, now less than one million units at annual rates, is faltering. Moreover, home prices nationally have not made it back to 2005. Mortgage interest rates, which jumped in May last year and are steady since then, are blamed by some analysts for the weakness. Others cite difficulties in qualifying for loans and concerns about consumer confidence. The result is less demand and fewer homes being built.
Five years into the recovery from the recession, the economy will need to look to gains in consumer spending and business investment more than housing. Long overdue activity in residential construction would be welcome, but is certainly not assured.

