It looked like the market was finally going to break out of its funk early last week. But, by Thursday it was clear the rally effort wasn’t a breakout, but just another fakeout. The bulls are still within striking distance of a breakout, but even some of the staunchest of optimists are starting to lose hope.Â
The good news is, while there may be a bearish outcome in the near-term cards, at least we know exactly where the market’s key lines in the sand are.
We’ll look at those lines in a second, right after we dissect last week’s and this week’s economic news.Â
Economic Calendar
It was a pretty busy week on the economic data front… more than we can talk about at length.  We’ll have to stick with the highlights, beginning with the biggie – inflation.  In a nutshell, we finally have some of it.
As of April, the producer price inflation rate stands at 2.1%.  That’s the highest reading we’ve seen since early-2012 (and it was falling then).  The annualized consumer inflation rate reached 1.96% last month… the highest reading since mid-2013.
It’s important to understand that neither rate is at outrageous, out-of-control levels. Â The worry is, however, that we may finally be seeing an inevitable result of years of cheap money/low interest rates. Â If inflation continues to rise and threaten the 3.0% mark, that’s a concern. Â Only time will tell.
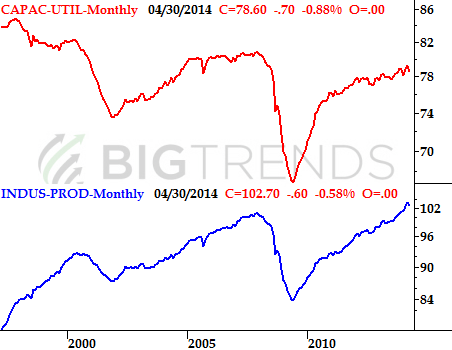
It was also a big week for industrial production numbers… but not a great week.  Both the Industrial Productivity Index and the Capacity Utilization Index fell in April, for the first time in a while.  They weren’t precipitous drops, but there wasn’t any room for weakness from either.  It’s too soon to sound the alarm bell just yet, but if May doles out another slide from these numbers, that could be a sign of trouble.
Industrial Production & Capacity Utilization Chart

