EURUSD undermined by ECB, Bundesbank, and EU data, yet declines minimally thus far – resilience or nascent breakdown ahead? Our take, plus the bullish, bearish drivers, what to watch this week.
The following is a partial summary of the conclusions from the fxempire.com weekly analysts’ meeting in which we cover outlooks for the major pairs for the coming week and beyond.
Summary
- Technical outlook: Neutral medium term per weekly charts. Bearish near term on daily charts, as the pair looks set to test strong support around 1.365.
- The controlled nature of the pullback, with pauses at each support level on weekly charts despite coming easing, suggests the resilience of a technical pullback rather than the start of a longer term reversal. See below for details on why.
- Fundamental outlook short term mildly bearish. ECB comments and weak EU data continue to pressure the EURUSD to test lower support levels. However persistent low USD benchmark rates, and market complacency about risks, limits chances of longer term EURUSD reversal for now.
- Fundamental outlook longer term neutral: The USD’s advantages of more supportive economic data and Fed policy have yet to translate into a yield advantage needed for a sustained move lower. Longer term fundamentals remain steady
- Trader Positioning: Our sample of traders swung over from short to long and remains long, see below for implications.
- Conclusions: Is the pair topping out or just having a normal bear market pullback? Our take, why, and what would change our mind.
TECHNICAL OUTLOOK
First we look at overall risk appetite as portrayed by our sample of global indexes, because the EURUSD has been tracking these fairly well recently.
Overall Risk Appetite Per Weekly Charts Of Leading Global Stock Indexes
This week we again minimize our usual discussion of overall risk appetite per our sample of leading global stock indexes. For the past 2 weeks they haven’t helped us forecast EURUSD moves:
- The EURUSD has ceased tracking these indexes and for now is moving mostly with its own specific fundamental drivers, rather than overall risk appetite, and it is likely to continue to do so this week. See the fundamental outlook section below for specifics. Â
- The leading US and European indexes continue to flash neutral near term trends characterized by narrow, flat ranges, full of indecisive ‘doji’ candles on their weekly charts.
We’ll just note that the medium term technical outlook for the US and European indexes per their weekly charts remains overall bullish, either flat or moving higher in the near term, and thus supportive for the pair.
EURUSD Weekly Technical Outlook: Neutral Momentum, Strong Support Limited Medium Term Downside

EURUSD Weekly Outlook: Is Recent Price Action Showing Weakness Or Resilience?
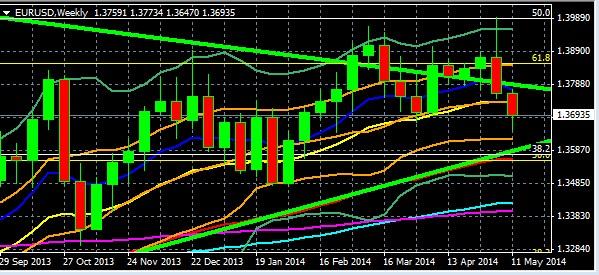
EURUSD Weekly Chart Week of September 29 2013 to PresentÂ
KEY: 10 Week EMA Dark Blue, 20 WEEK EMA Yellow, 50 WEEK EMA Red, 100 WEEK EMA Light Blue, 200 WEEK EMA Violet, DOUBLE BOLLINGER BANDS: Normal 2 Standard Deviations Green, 1 Standard Deviation Orange. Green downtrend line from EURUSD peak of July 2008 to present, green uptrend line from August 2012 to present.
Source: MetaQuotes Software Corp, www.fxempire.com, www.thesensibleguidetoforex.com
02 May. 17 21.58
Key Take-Aways Weekly Chart:
1.375 support area broke, 1.37 zone bending but not broken at the pair closed the week at 1.3696.
While the pair remains in its 14 week trading range, the medium term momentum is neutral as the pair remains firmly within its neutral double Bollinger ® band zone. Friday’s drop suggests at least a test of deeper support around 1.365. If that breaks, the next big support is around 1.36 -1.355, buttressed by four layers of support:
–The round 1.355 figure itself
–The green uptrend line dating from mid-2012
–The 50% Fibonacci retracement of the downtrend from mid-2011 to mid-2012.
–The 38.2% Fibonacci retracement of the bigger downtrend from July 2008 to June 2010
These can be seen on the EURUSD monthly chart which we posted last week here.
EURUSD Daily Technical Outlook
 
EURUSD Daily Chart April 9 To Present
KEY: 10 Week EMA Dark Blue, 20 WEEK EMA Yellow, 50 WEEK EMA Red, 100 WEEK EMA Light Blue, 200 WEEK EMA Violet, DOUBLE BOLLINGER BANDS: Normal 2 Standard Deviations Green, 1 Standard Deviation Orange. Green downtrend line from EURUSD peak of July 2008 to present, green uptrend line from August 2012 to present.
Source: MetaQuotes Software Corp, www.fxempire.com, www.thesensibleguidetoforex.com
03 May. 17 22.25
Key Take-Aways Daily Chart
The only real movement came on the drop following Tuesday’s news that the Bundesbank supported further easing.
After Wednesday’s mild bounce and Thursday’s indecisive doji, Friday’s lower close suggests that trader’s see a test of deeper support to around 1.365, which is buttressed by:
- The psychologically important 1.365 round number
- The 200 day EMA (violet)
All momentum indicators on daily charts tell the same story of strengthening downward momentum. For example, the pair remains firmly in the double Bollinger ® band sell zone on the above daily chart
FUNDAMENTAL OUTLOOK: THE BALANCE OF BULLISH VS. BEARISH
Here’s the short version.
The primary fundamental drivers of the pair’s continued downtrend were variations on the same themes as last week:
- Rising speculation about ECB easing. In addition to Draghi’s comments from last week, Germany’s central bank signaled its support for further easing. Bundesbank officials claimed they had not changed policy, and that they were always open to easing if EU data continued to weaken.
- Continued weak EU data, particularly in comparison to that of the US, supported the above speculation.
- Also similar to last week, key support levels continued to define the extent of the pair’s decline. Last week the pair stabilized at near term support around 1.3750. After the Bundesbank remarks Tuesday the EURUSD began testing the next major near term support level around 1.367. After attempting a recovery, weak inflation and CPI data Thursday spurred a further test towards deeper support into the end of the week.
- Despite all of these negatives, the EURUSD’s decline looks more like a demonstration of resilience than a coming reversal, as each of the above waves of bad news have brought only incremental pullbacks to the next levels of near term support and overall only a minor pullback. Here’s why:
- Given the 14 week narrow trading range and stability of long term drivers, near term support and resistance are limiting volatility.
- The consensus is that the coming ECB easing steps will be relatively conservative and avoid any US-style QE, as discussed in more detail below. However given how low rates are already, such cuts are unlikely to encourage new lending and thus lift inflation, especially given the coming ECB bank stress tests, which encourage banks to hoard cash rather than lend it
