So much for the “Sell in May” axiom. Â The market just logged its second bullish week in a row at a time of year that’s not supposed to be bullish at all. Â For May, the S&P 500 (SPX) (SPY) gained an impressive and surprising 1.8%. Â
Is this a sign that stocks are just so hot and so underestimated that there’s just no stopping them? Â Or, were the past couple of weeks just a little lucky volatility we’ll end up paying the price for in June in the form of a pullback?Â
We’ll weigh the odds in a moment, right after a run-down of last week’s and this week’s most important economic numbers.Â
Economic Calendar
It wasn’t a terribly busy week in terms of the amount of data we get, but a couple of the items we got were more than a little important.Â
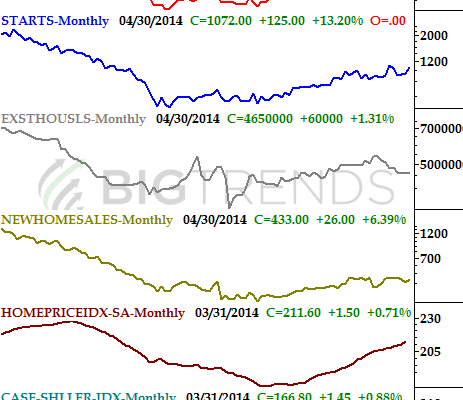
We kicked things off on Tuesday with the last of the real estate data we’d be getting in May… the Case-Shiller Index (of home prices) and the FHFA Housing Price Index.  Both showed strength, jiving with the other housing and construction data we had heard over the course of the two weeks before the home pricing data was revealed.  The Case-Shiller Index said home prices in March were up 12.4%, while the FHFA reported a comparable 0.7% uptick in March’s prices compared to February’s levels.  Bear in mind these two data sets are a month behind the rest of the housing data, though the delay doesn’t negate the fact that we’re seeing a rebound here from the late-2013 lull.
Real Estate Trends Chart
Source:Â Â Standard & Poor’s, FHFA, Census Bureau, and National Association of RealtorsÂ
We also got an updated estimate on Q1’s GDP growth… .not exactly an award-winner.  The initial estimate given last month was for a mere 0.1% uptick, but with more data in hand, now it looks like the economy actually shrunk 1.0% in the first quarter.  The third and final estimate will be posted in a couple of weeks, but it’s unlikely we’ll see any major changes.

