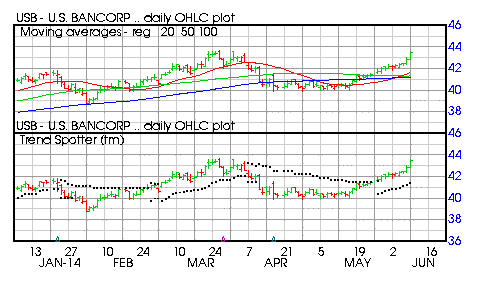
Today I used Barchart to sort the S&P 500 Large Cap Index to find the stock with the best momentum, technical indicators and charts. First I sorted the Index for the most frequent new highs in the last month, then used the Flipchart feature to review the charts.
Today’s list includes US Bancorp (USB), Lam Research (LRCX), Southwest Airlines (LUV), Netflix (NFLX) and Apple (AAPL):
US Bancorp (USB)

Barchart technical indicators:
- 100% Barchart technical buy signals
- Trend Spotter buy signal
- Above its 20, 50 and 100 day moving averages
- 16 new highs and up 7.94% in the last month
- Relative Strength Index 80.63%
- Barchart computes a technical support level at 42.54
- Recently traded at 43.52 with a 50 day moving average of 41.32
Lam Research (LRCX)

Barchart technical indicators:
- 96% Barchart technical buy signals
- Trend Spotter buy signal
- Above its 20, 50 and 100 day moving averages
- 16 new highs and up 13.75% in the last month
- Relative Strength Index 77.92%
- Barchart computes a technical support level at 64.46
- Recently traded at 65.04 with a 50 day moving average of 57.53
Southwest Airlines (LUV)

Barchart technical indicators:
- 96% Barchart technical buy signals
- Trend Spotter buy signal
- Above its 20, 50 and 100 day moving averages
- 15 new highs and up 12.68% in the last month
- Relative Strength Index 78.75%
- Barchart computes a technical support level at 26.99
- Recently traded at 27.45 with a 50 day moving average of 24.66
Netflix (NFLX)

Barchart technical indicators:
- 80% Barchart technical buy signals
- Trend Spotter buy signal
- Above its 20, 50 and 100 day moving average
- 15 new highs and up 28.77% in the last month
- Relative Strength Index 68.75%
- Barchart computes a technical support level at 414.05
- Recently traded at 423.09 with a 50 day moving average of 360.39
Apple (AAPL)

