FX Traders’ weekly EURUSD fundamental & technical picture, this week’s market drivers that could change it- the bullish, the bearish and likely EURUSD direction.
The following is a partial summary of the conclusions from the fxempire.com weekly analysts’ meeting in which we cover outlooks for the major pairs for the coming week and beyond.
Summary
- Technical Outlook: The pair remains within its 1.35-7 trading range, with any breaches of the 1.35 area likely just temporary as long as the fundamentals that have supported the EURUSD hold. Our directional bias remains bearish.
- Fundamental Outlook: Neutral near term, bearish longer term, and what could change this outlook
- Trader Positioning: Pros steady, small retail traders shift strongly to the long site
- Conclusions: What’s preserving the current likely trading range and what to monitor to anticipate the eventual breakout
TECHNICAL OUTLOOK
Summary
Short Term Technical Outlook: Neutral, as downward momentum clashes with strong support at 1.3500. That level is likely to break, see below for whether it’s likely to happen this week.
Medium & Long Term Technical Outlook: Bearish – all momentum indicators on weekly charts suggest more downside in the coming months.
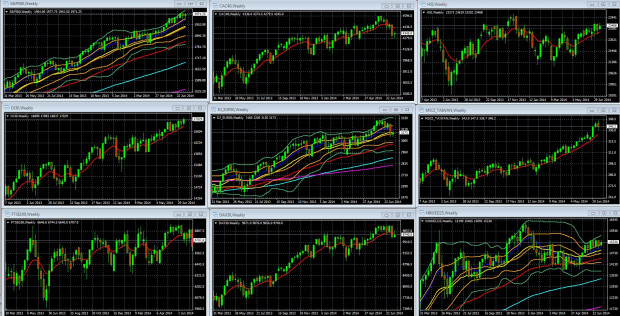
First we look at overall risk appetite as portrayed by our sample of global indexes, because the EURUSD usually tracks these fairly well, particularly the leading US and European indexes. The main exception to this rule comes when either the Fed or ECB is expected to make a policy change in the near future, because changing interest rate expectations are more influential than overall risk appetite trends.
Overall Risk Appetite Per Weekly Charts Of Leading Global Stock Indexes

Weekly Charts Of Large Cap Global Indexes  March 31 2013 To Present, With 10 Week/200 Day EMA In Red: LEFT COLUMN TOP TO BOTTOM: S&P 500, DJ 30, FTSE 100, MIDDLE: CAC 40, DJ EUR 50, DAX 30, RIGHT: HANG SENG, MSCI TAIWAN, NIKKEI 225
Key For S&P 500, DJ EUR 50, Nikkei 225 Weekly Chart: 10 Week EMA Dark Blue, 20 WEEK EMA Yellow, 50 WEEK EMA Red, 100 WEEK EMA Light Blue, 200 WEEK EMA Violet, DOUBLE BOLLINGER BANDS: Normal 2 Standard Deviations Green, 1 Standard Deviation Orange.
Source: MetaQuotes Software Corp, www.fxempire.com, www.thesensibleguidetoforex.com
01 Jul. 19 22.06
Key Take-Aways Weekly Chart
The short version: The overall risk appetite picture is mixed and thus doesn’t offer any obvious support or hindrance to the EURUSD.
- Short term risk appetite per the US and EU indexes is mixed. In recent weeks US indexes have been flat to higher, while European indexes have been trending lower.
- The same holds for the intermediate term (past 4 weeks).
EURUSD Weekly Technical Outlook

EURUSD Weekly Chart to Present June 10. 2012 To Week Ending July 18, 2014
KEY: 10 Week EMA Dark Blue, 20 WEEK EMA Yellow, 50 WEEK EMA Red, 100 WEEK EMA Light Blue, 200 WEEK EMA Violet, DOUBLE BOLLINGER BANDS Normal 2 Standard Deviations Green, 1 Standard Deviation Orange. Green downtrend line from EURUSD peak of July 2008 to present, green uptrend line from August 2012 to present. White Fibonacci retracement lines for downtrend of August 2008 To June 2010, yellow Fibonacci retracement lines for downtrend of May 2011 To July 2011.
Source: MetaQuotes Software Corp, www.fxempire.com, www.thesensibleguidetoforex.com
02 Jul. 19 22.07
Key Take-Aways Weekly EURUSD Chart: Bearish Momentum Versus Strong Support
The medium term EURUSD prognosis continues to deteriorate.
Momentum Becoming More Negative
–Until May the pair had been in a steady uptrend since August 2012. The current downtrend that began in mid-May is the longest counter move to that uptrend.
