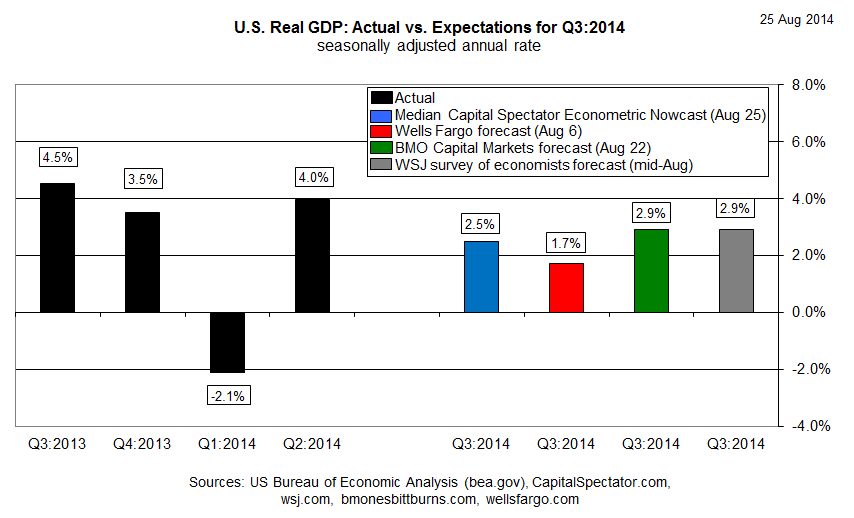
The surprisingly strong rebound in second-quarter GDP growth will suffer a substantial bout of deceleration in the third quarter, according to the Capital Spectator’s median econometric nowcast. The US economy is projected to increase 2.5% (real seasonally adjusted annual rate) in the July-through-September period, down from the 4.0% rate reported by the Bureau of Economic Analysis (BEA) for Q2.
The current nowcast is a preliminary estimate, of course, and one that’s based on limited data for Q3. The optimistic view is that the incoming numbers will improve between now and October 30, when the BEA will publish its “advance†GDP report for Q3. Based on the figures available today, however, the case for expecting that the next batch of GDP numbers will echo the upbeat Q2 data is a bit wobbly.
Meantime, looking backward still inspires hope for something better, and that’s not expected to change in this week’s round of updated GDP numbers. BEA is scheduled to release its second GDP estimate for Q2 on Thursday (Aug. 28) and the consensus forecast sees the growth rate sticking to the 4.0% rate, according to Breifing.com’s survey of economists.
As for looking ahead, many analysts anticipate slower growth for Q3. The August edition of The Wall Street Journal’s economic survey, for instance, projects growth of 2.9% for July through September.
For additional perspective on the outlook, here’s a graphical review of how The Capital Spectator’s updated Q3 nowcast compares with recent history and forecasts from other sources:

Next, let’s review the individual nowcasts that are used to calculate the median estimate:

As updated nowcasts are published, the chart below will track the changes for context in assessing how the projections are evolving.

Finally, here’s a brief profile for each of The Capital Spectator’s GDP nowcast methodologies:
R-4: This estimate is based on a multiple regression in R of historical GDP data vs. quarterly changes for four key economic indicators: real personal consumption expenditures (or real retail sales for the current month until the PCE report is published), real personal income less government transfers, industrial production, and private non-farm payrolls. The model estimates the statistical relationships from the early 1970s to the present. The estimates are revised as new data is published.
