After last week’s dramas, here are the lessons and likely market movers to keep in mind for most global markets
Summary
–Technical Outlook: Short Term Neutral US And Asia, Neutral/Bullish For Europe, Medium Term Bullish All 3 Regions
–Fundamental Outlook 1: Lessons from the latest on the state of the global stock rally, the ECB’s new stimulus moves, US jobs reports, and more
–Fundamental Outlook 2: Likely market movers for this week and beyond, and how weak EU PMIs moved multiple markets
– Biggest Questions & What To Watch To Answer Them
Â
TECHNICAL PICTURE
We look at the technical picture first for a number of reasons, including:
Chart Don’t Lie: Dramatic headlines and dominant news themes don’t necessarily move markets. Price action is critical for understanding what events and developments are and are not actually driving markets. There’s nothing like flat or trendless price action to tell you to discount seemingly dramatic headlines – or to get you thinking about why a given risk is not being priced in
Charts Also Move Markets: Support, resistance, and momentum indicators also move markets, especially in the absence of surprises from top tier news and economic reports. For example, the stronger a given support or resistance level, the more likely a trend is to pause at that point. Similarly, a confirmed break above key resistance makes traders much more receptive to positive news that provides an excuse to trade in that direction.
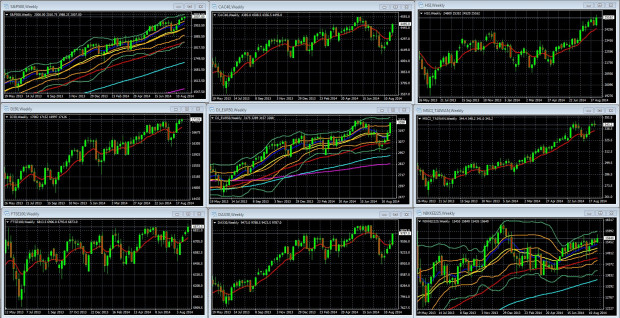
Overall Risk Appetite Medium Term Per Weekly Charts Of Leading Global Stock Indexes
Â

Â
Weekly Charts Of Large Cap Global Indexes May 19 2013 To August 5 2014:Â With 10 Week/200 Day EMA In Red: LEFT COLUMN TOP TO BOTTOM: S&P 500, DJ 30, FTSE 100, MIDDLE: CAC 40, DJ EUR 50, DAX 30, RIGHT: HANG SENG, MSCI TAIWAN, NIKKEI 225
Key For S&P 500, DJ EUR 50, Nikkei 225 Weekly Chart: 10 Week EMA Dark Blue, 20 WEEK EMA Yellow, 50 WEEK EMA Red, 100 WEEK EMA Light Blue, 200 WEEK EMA Violet, DOUBLE BOLLINGER BANDS: Normal 2 Standard Deviations Green, 1 Standard Deviation Orange.
Source: MetaQuotes Software Corp, www.fxempire.com, www.thesensibleguidetoforex.com
03 Sep. 07 13.18
Â
Key Points And Lessons Weekly Charts: Medium Term Bullish
Given that this week’s economic calendar is very light on US and EU events, technical factors like support/resistance levels and momentum have a higher chance of influencing price movement in the major global indexes
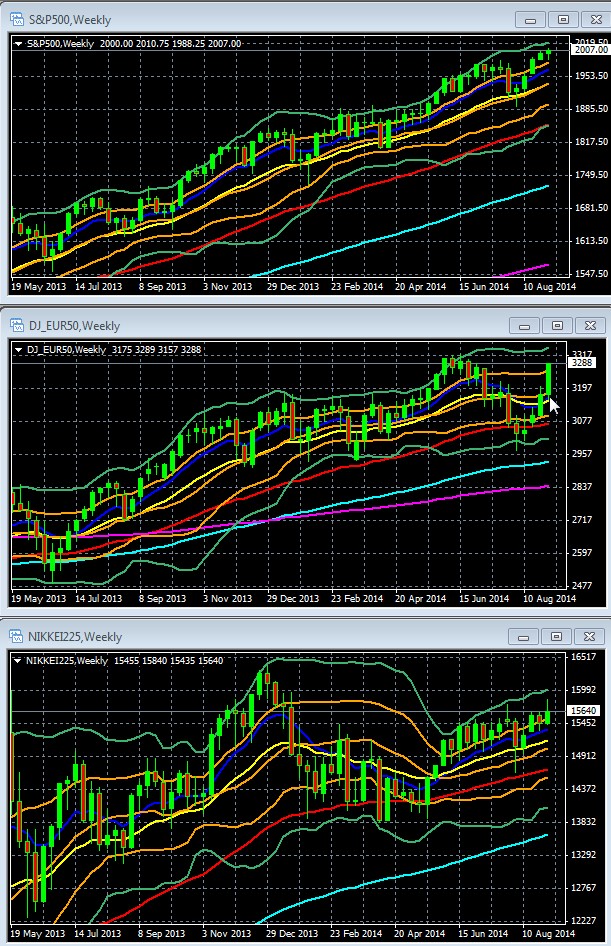
European Indexes Close Performance Gap On New ECB Stimulus News
Powered by the surprise announcement of new stimulus coming from the ECB, European indexes have re-joined their US and European counterparts in the double Bollinger® band buy zone, as shown in a sample of the charts below. That suggests the odds favor more upside.
Â
Â
Key For S&P 500, DJ EUR 50, Nikkei 225 Daily Chart: 10 day EMA Dark Blue, 20 day EMA Yellow, 50 day EMA Red, 100 day EMA Light Blue, 200 day EMA Violet, DOUBLE BOLLINGER BANDS: Normal 2 Standard Deviations Green, 1 Standard Deviation Orange.
Source: MetaQuotes Software Corp, www.fxempire.com, www.thesensibleguidetoforex.com
07 Sep. 07 18.02
Sure, the EU’s economy reeks like an open sewer, and is burdened with a dysfunctional currency zone that it has proven incapable of reforming (see details on its failed banking union deal here and here for just one example). Yes, the whole Ukraine related sanctions thing could eventually produce another meaningful drag on an already weak economy. So what? The big lesson of recent years is that unless there is an imminent threat to the global economy, you don’t need an especially healthy economy for stocks to rise. The combination of abundant cash and suppressed rates forces investors into equities. It won’t last forever, but what does.
In sum, with most leading indexes continuing to show upward momentum, the odds favor more upside in the medium term. As for near term support and resistance, note that the economic calendar is light this week, and so investors should not expect their relevant index and market to move far beyond the highs and lows of prior weeks.
