I’m not a prophet of doom but I’m accumulating cash. I’m selling any stock that is trading below its 100 day moving average and I’m not replacing anything in my personal portfolios. I have an optimism/pessimism index and right now that index is at a negative. I truly believe that in the short run – at least until after the mid-term elections; there is more downside risk to being in the market than there is upside risk to be sitting on the sidelines with your powder dry. Let me document why I think that way.
Let’s look at the Market as a whole:
As I write this post just how many stock are trading below their moving averages?
- 83.40% are below their 20 day moving average
- 74.47% are below their 50 day moving average
- 69.32% are below their 100 day moving averages
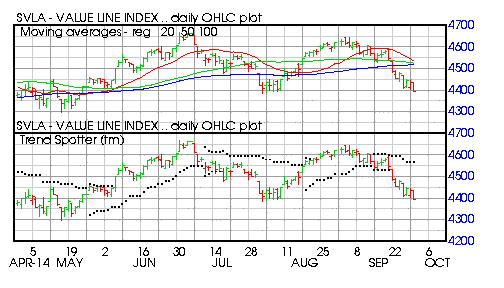
I use the Value Line Arithmetic Index as my Market proxy because it contains 1700 stock, well over 95% of the entire capitalization of the US stock market and it equally weights all stocks – the big boys do not overly influence this Index:

Barchart technical indicators:
Â
- 56% Barchart technical sell signals
- Trend Spotter sell signal
- Below its 20, 50 and 100 day moving averages
- 5.89% off its recent high
- Relative Strength Index 32.60%
I like to stratify the Market by separating the Large Cap, Mid Cap, Small Cap and Micro Caps. The easiest was to do that is to analyze 4 market cap ETF’s:
S&P 500 Large Cap Index ETFÂ (NYSEARCA:IVV)

Barchart technical indicators:
Â
- 24% Barchart technical sell signals
- Trend Spotter sell signal
- Below its 20, 50 and 100 day moving averages
- 3.20% off its recent high
- Relative Strength Index 39.08
S&P 500 Large Cap Index ETFÂ (NYSEARCA:IJH)

Barchart technical indicators:
Â
- 48% Barchart technical sell signals
- Trend Spotter sell signal
- Below its 20, 50 and 100 day moving averages
- 5.91% off its recent high
- Relative Strength Index 30.15%

