Confused why one second the market is down 1%, and then moments later, upon returning from the bathroom, one finds it up by the same amount on negligible volume? Simple: there continues to be zero liquidity. Although, not just in equities, but in bonds as well, something this website – and the TBAC and Citi’s Matt King – has warned for over year. It is the lack of bond liquidity that led to last week’s dramatic surge in bond prices as Bloomberg noticed overnight.
So for those curious just how bad bond liquidity is now, here is JPM’s Nikolaos Panigirtzoglou with the explanation:
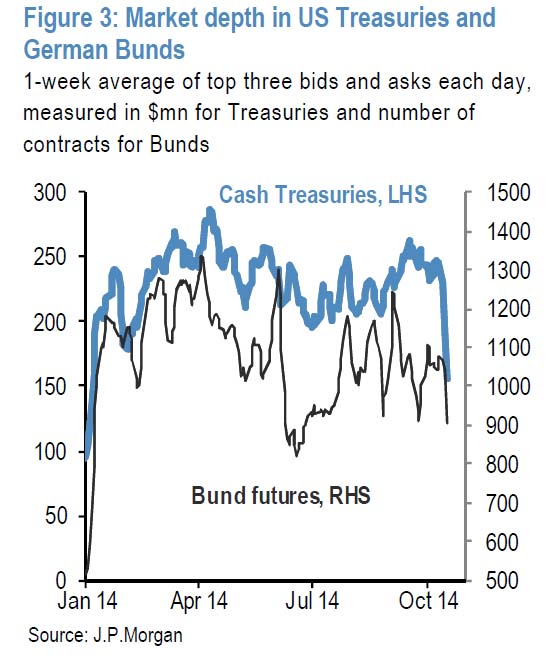
For the safest bond markets, bid-ask spreads typically remain very narrow in good times and bad, and shifts in liquidity conditions are best captured by changes in market depth. Our fixed income research measures market depth by averaging the size of the three best bids and offers each day for key markets. Figure 3 shows two such measures, for 10-year cash Treasuries (market depth measured in $mn) and German Bund futures (market depth measured in number of contracts). Again, these measures appear consistent with deterioration in market depth i.e. the ability to transact in size without impacting market prices too much. The recent deterioration in market depth has been more acute for USTs than Bunds, also evidenced by the large daily moves in UST yields in recent days.
Â

Yeah, ok. Nothing new: wondering who the culprit is, look no further than the Fed which now owns 35% of all 10 Year equivalents across the curve, a liquidity shortfall for everyone else that will only get worse if and when the Fed embarks on QE4 (just a matter of time), as we explained last May in “TBAC.”
But what about equities: turns out here things are worse. Much worse. About 40% worse according to JPM’s take of CME data:
An alternative liquidity measure comes from the CME, which reports a quarterly measure of “market depthâ€, that is, the transaction cost of trading in reasonable size across a selection of futures markets (e.g. for Mini S&P500 futures, 500 contracts lot). This measure shows how deep the market is in terms of the quantity of orders resting on the best bid and best offer, i.e. number of contracts at best bid-ask spread in the limit order book. The quarterly change in this measure between June and September as % of its average over the past three years is shown in Figure 4. Over the past quarter there has been significant deterioration in the market depth for S&P500 and Crude Oil futures but an improvement for agricultural commodity futures. There has been no material change in the market depth for FX, i.e. euro and yen futures contracts, over the past quarter. The market depth metric for these contracts continues to be at the very top of the past three years’ range.
Â

