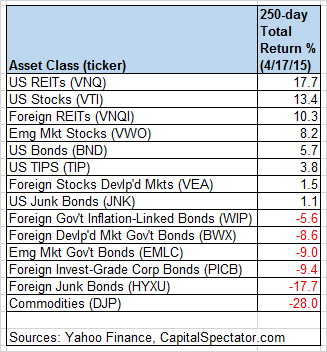
The unusually wide spread at the outer edges for the trailing performances of the major asset classes via our standard set of ETF proxies has been squeezed a bit. The compression is due mostly to recent weakness in US real estate investment trusts (REITs). Securitized real estate is still in the lead for the trailing one-year period (250 trading days) through Friday (Apr. 17), but the performance advantage has been pared in recent weeks. The Vanguard REIT (VNQ) is ahead by nearly 18% for the past year, but that’s well down from the nearly 30% surge for that trailing period in last month’s update.
Commodities, meanwhile, have been rising lately, albeit modestly so and after months of nearly non-stop losses. Nonetheless, the recent uptick has yet to make a dent in the trailing one-year return, which remains deeply in the red to the tune of a 28% loss over the past 250 trading days.

Here’s a graphical recap of the relative performance histories for each of the major asset classes for the past 250 trading days via the ETF proxies. The chart below shows the performance records through Apr. 17, 2015, with all the ETFs rebased to a year-ago starting-value of 100. REITs are stil in the lead (dark blue line at top of chart below) vs. the rest of the field, but the performance edge has narrowed.

Now let’s review an ETF-based version of an unmanaged, market-value-weighted mix of all the major asset classes — the Global Market Index Fund, or GMI.F, which holds all the ETFs in the table above. Here’s how GMI.F stacks up for the past 250 trading days through Apr. 17, 2015. This investable strategy is ahead by a moderate 5.0% over that span — well below the performance for US stocks (VTI) and incrementally behind than the 5.3% return for US bonds (BND) at the moment.

Comparing the median dispersion for 250-day returns for the major asset classes via ETFs suggests that the general rebalancing opportunity has increased for GMI.F vs. recent history. Analyzing the components of GMI.F with a rolling median absolute deviation via one-year returns for the ETFs — the GMI.F Rebalancing Opportunity Index, as it’s labeled on these pages — suggests that there’s enhanced potential for adding value by reweighting this portfolio in comparison with the past year. Keep in mind that the opportunity for productive rebalancing will vary depending on the choice of holdings and historical time window. Also, don’t overlook the possibility that any given pair of ETFs may present a substantially greater or lesser degree of rebalancing opportunity vs. analyzing GMI.F’s components collectively, which is the methodology that’s reflected in the chart below. Note that the chart focuses on looking backward. If you’re confident in your forecast for risk and return, the ex ante view of rebalancing opportunity may paint a distinctly different outlook vs. an ex post analysis.
