T2108 Status: 32.4%
T2107 Status: 35.8%
VIX Status: 13.4
General (Short-term) Trading Call: Neutral
Active T2108 periods: Day #200 over 20%, Day #8 over 30% (overperiod), Day #15 under 40%, Day #55 under 50%, Day #72 under 60%, Day #271 under 70%
Reference Charts (click for view of last 6 months from Stockcharts.com):
S&P 500 or SPY
SDS (ProShares UltraShort S&P500)
U.S. Dollar Index (volatility index)
EEM (iShares MSCI Emerging Markets)
VIX (volatility index)
VXX (iPath S&P 500 VIX Short-Term Futures ETN)
EWG (iShares MSCI Germany Index Fund)
CAT (Caterpillar).
Commentary
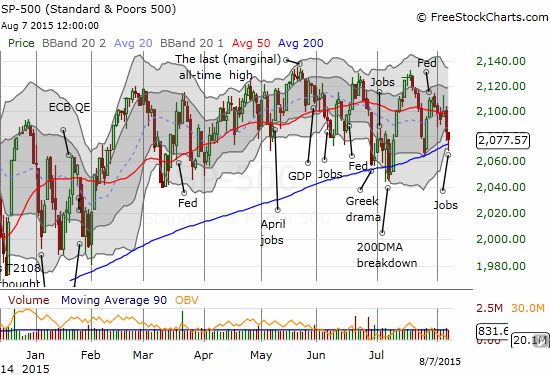
The S&P 500 (SPY) has tested its 200DMA support for four cycles (depending on how you want to count) in just the last six weeks. Each test has produced the predictable outcome for a bull market that remains in an uptrend: a bounce off support.

The S&P 500 keeps pounding away at its 200DMA support. How much longer can this go on without “resolution�
The latest test came as the market reacted to the July jobs number. The economic data seem like more of the same to me, so I cannot connect any dots from the data to the market. What I CAN say is that the U.S. dollar once again failed to break through its downtrend while the S&P 500 lost fractionally. I can also observe the 50DMA starting to turn downward. Moreover, the S&P 500 has failed to make a fresh all-time high from any of the bounces of support. Taken together, these behaviors imply a market in a weakening phase where buying power is subtly fading; the buyers are just barely able to rouse themselves enough for automatic purchases at support.
T2108 fell to 32.4% on the day. While T2108 is close again to “oversold enough†conditions to warrant some T2108 buys, I am not triggering. I now strongly prefer a true oversold reading to do any fresh (aggressive) T2108 trades. The market’s internals just look too shaky to me to warrant anything more optimistic.
T2107, the percentage of stocks trading above their 200-day moving averages, really screams out alarm at this point. T2108 has not traded over 50% since late June, and the indicator is still trapped in a definitive downtrend since 2015’s high in April.
