We get into the heart of the Q4 earnings season this week, with 485 companies reporting quarterly results, including 121 S&P 500 members. With results from 201 index members already on the books, we will have seen Q4 results from over 63% the S&P 500 members by the end of this week.
The picture emerging from the results that we have seen already is one of all around weakness, with growth hard to come by in the slowing global economy, the strong U.S. dollar, and weakness in the oil and other commodity sectors. This isn’t a new problem, we have been discussing these headwinds the last few reporting cycles as well. In other words, the earnings recession continues with Q4 earnings for the S&P 500 index on track to be below the year-earlier level – the third quarter in a row of negative earnings growth for the index.
Recent weakness in oil and other commodity prices has effectively guaranteed that this negative growth trend will continue into the current and following periods as well. In fact, all of the earnings growth for the S&P 500 index in 2016 is now entirely expected to come in the back half of the year, with growth in the first half of the year now expected to be in the negative.
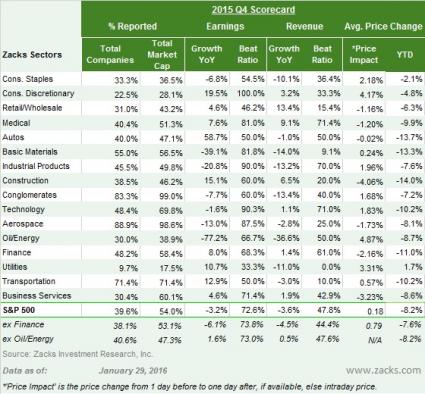
Q4 Scorecard (as of Friday, January 29th)
Total earnings for the 201 S&P 500 members that have reported results already are down -3.2% on -3.6% lower revenues, with 72.6% beating EPS estimates and 47.8% coming ahead of top-line expectations. With these 201 index members accounting for 54% of the index’s total market capitalization, we have effectively crossed the halfway mark in the Q4 reporting cycle.
The table below provides the current Q4 scorecard

The aggregate growth picture is actually even weaker once adjusted for the +8% growth in the Finance sector, which itself is benefiting from easy comparisons at Citigroup (C - Analyst Report). Excluding the Finance sector, total earnings for the rest of the index members that have reported results would be down -6.1% on -4.5% lower revenues.
The charts below provide a comparison of the results thus far with what we have seen from this same group of 201 S&P 500 members in other recent periods.
