The picture emerging from the Q2 earnings results thus far is one of modest improvement from the extremely weak levels over the last couple of quarters. Growth is still non-existent and Q2 is on track to be the 5th quarter in a row of earnings declines for the S&P 500 index. That said, the results thus far are indicating that the worst may be behind us. If the coming results confirm this trend as well, then we can start having a little more confidence in earnings expectations for the second half and beyond.
The reporting cycle really accelerates this week, with almost 1000 companies coming out with Q2 results, including 189 S&P 500 members. This week’s line-up packs plenty of leaders from all the key sectors, ranging from Apple (AAPL –Analyst Report) and Facebook (FB - Analyst Report) to Caterpillar (CAT - Analyst Report) , Exxon (XOM - Analyst Report) and much more in between. As such, it may not be unfair to characterize this week as a make or break week for the Q2 earnings season. This week will either fully confirm the reassuring and encouraging start we have had thus far or turn it around in the opposite direction.But the trends established this week will carry through the rest of this reporting cycle with only minor changes.
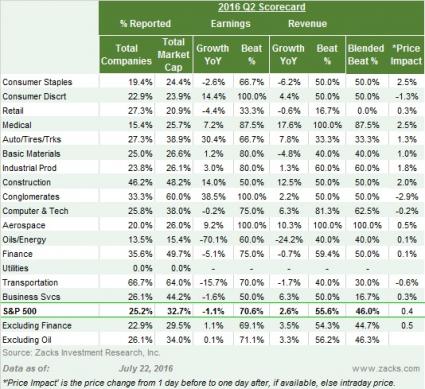
The Q2 Earnings Scorecard (as of July 22nd)
We now have Q2 results from 126 S&P 500 members that combined account for 32.7% of the index’s total market capitalization. Total earnings for these 126 companies are down -1.1% from the same period last year on -2.6% lower revenues, with 70.6% beating EPS estimates and 55.6% coming ahead of top-line expectations.
The table below provides the current scorecard

With results from almost one-third of the index’s total market capitalization out, we have a pretty representative sample of this quarter’s earnings already. At this stage, the Utilities sector is the only one that has yet to report results and the Energy sector has the fewest. For all the other sectors, we have results from at least one-fifth of their respective market caps in the index.
The side-by-side charts below compare the results thus far from the 126 index members with what we have seen from the same group of index members in other recent periods. The left-hand chart compares the earnings and revenue growth rates with historical periods while the right-hand chart is doing the same comparisons for positive EPS and revenue surprises.
