“…for the last 8 years, being positive is easier to make money.â€
No truer words said by a trading friend of mine who essentially scolded me for my switch to bearishness this week. I wish I had a crystal ball, but at the time I made a judgement call that the S&P 500 (SPY) was close enough to a breakdown from its trading range. The earlier bearish divergence between the S&P 500 (SPY) and T2108 (the percentage of stocks trading above their 40-day moving averages (DMAs)) reinforced my confidence in moving forward with a bearish trading call. I now have flashbacks to post-Brexit trading where I made a very close call to stay bearish because T2108 had not quite plunged into oversold territory. In THAT case, the tremendous spike in volatility, the VIX, should have made me at least less confident in the judgement call. In the current case, the extremely low level of volatility (aka complacency) made me even MORE confident in my call.

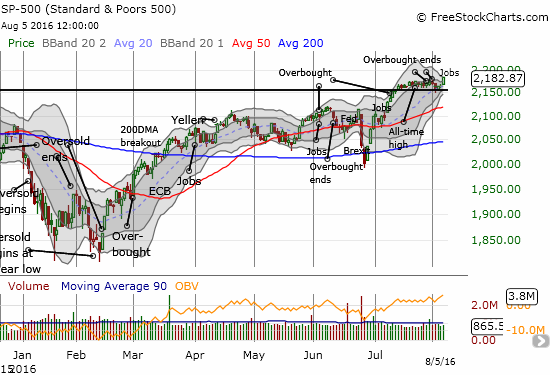
The S&P 500 (SPY) makes a new all-time as a Bollinger Band squeeze starts to form.

This weekly view of the VIX shows how volatility is in a zone that typically does not last long and precedes episodes of volatility spikes.
Note how a Bollinger Band (BB) squeeze is forming on the index. This move indicates a compression in volatility that will soon resolve into a big move up or down. Given volatility is so low, I am still inclined to believe that next move will be to the downside. T2108 did not help answer questions as it stopped just short of re-entering overbought conditions. The high was, incredibly enough, 69.99% before settling in for a close at 69.19% (overbought is defined as T2108 above 70%). Given the breakout in the S&P 500, I moved the trading call to neutral and will not go back to bearish until a breakdown occurs with confirmation. I will go to cautiously bullish if T2018 closes in overbought territory. I just cannot shake the deceptive calm of an extremely low VIX in the middle of what is historically the roughest period for the stock market in terms of maximum drawdowns (August to October). This whole bullish setup looks like it is flirting with danger!

This year’s October drawdown made up for below average drawdowns in the S&P 500’s two other “most dangerous†months
{I have put an update of this chart on my to-do list. As traders know, 2014 and 2015 followed the pattern of big drawdowns somewhere between August and October.}
The S&P 500 closed at a new all-time high in the wake of a strong U.S. jobs report. While my bearish positions smarted, I was heartened to see the market actually respond positively to good economic news. I suspect the response occurred because of the renewed skepticism that the Fed will hike rates anytime soon and a growing recognition (acceptance) that the U.S. economy is one of the brightest sparks on the globe right now. The U.S. dollar (DXY0) strengthened accordingly although the odds for the next rate hike only moved from “don’t even think about it†to May, 2017.
