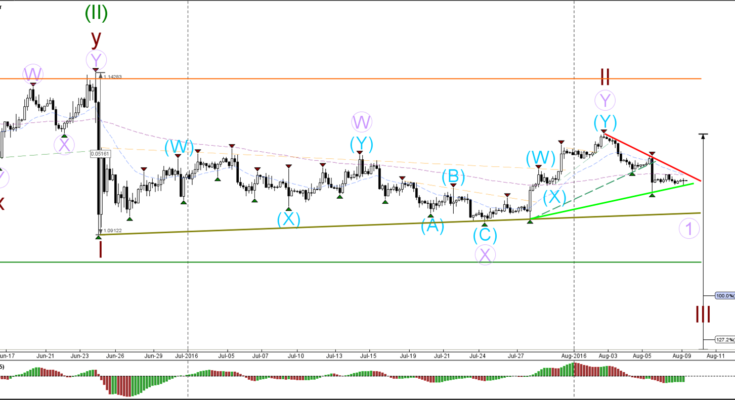
EUR/USD
4 hour

The EUR/USD is building a downtrend with lower lows and lower highs, which would be invalidated if price manages to break above the resistance trend line (red). A break below the support levels (green) should see a continuation of the bearish momentum.
1 hour

The EUR/USD is building an ABC (green) correction within wave 4 (blue). A break below the support level (green) could spark the start of the 5th wave (blue) whereas a break above the 50% Fibonacci level makes the development of a wave 4 (blue) less likely.
GBP/USD
4 hour

The GBP/USD would need to reach at least the 100% Fibonacci level before a wave 3 (pink) is confirmed but for the moment a bearish breakout is pushing with lower with lower lows and lower highs.
1 hour

The GBP/USD completed a wave 4 (blue) pullback as expected and then broke support levels (dotted green) to continue with the bearish momentum of wave 5 (blue). Price could now be heading towards the Fibonacci targets of wave 5 (blue).
USD/JPY
4 hour

The USD/JPY broke above the smaller resistance (dotted pink), which is confirming the larger bullish bounce at the support trend line (green). Price is slowing developing a trend reversal but a break above resistance (orange/red) is needed before larger bullish moves could be expected.
1 hour

The USD/JPY seems to be building a bull flag chart pattern (green/red lines) within an impulsive wave 3 (pink or green).

